Download
1 / 44
440 likes | 629 Vues
5.6 Transformations of the Sine and Cosine Graphs Mon Feb 3. Do Now Use the sine and cosine values of 0, pi/2, pi, 3pi/2 and 2pi to sketch the graph of f(x) = sin x and g(x) = cos x. Review of graphs. Y = sin x Period of 2pi Amplitude of 1 Goes through (0, 0). Review of Graphs.

E N D
5.6 Transformations of the Sine and Cosine GraphsMon Feb 3 Do Now Use the sine and cosine values of 0, pi/2, pi, 3pi/2 and 2pi to sketch the graph of f(x) = sin x and g(x) = cos x
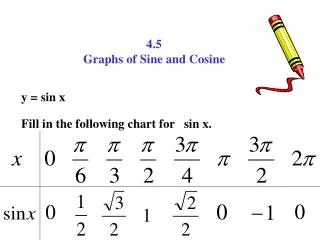
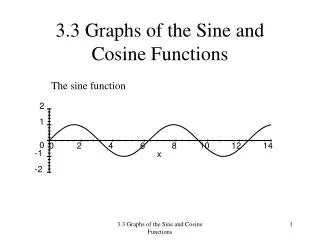
Review of graphs • Y = sin x • Period of 2pi • Amplitude of 1 • Goes through (0, 0)
Review of Graphs • Y = cos x • Period of 2pi • Amplitude of 1 • Goes through (0, 1)
Transformations • We are interested in the graphs of functions in the form
The Constant A • Recall that coefficients of functions result in a vertical shift / shrink • The constant A affects the amplitude of sine and cosine. The amplitude = A • If A is negative, the graph is upside down
Ex • Graph the following • 1) • 2) • 3)
The Constant B • Recall that coefficients of X result in a horizontal stretch / shrink • The constant B affects the period • The period of these graphs is
Ex • Sketch a graph of the following • 1) • 2)
The Constant C • The constant C, like in previous functions, results in a horizontal shift C units right / left • This is also known as a phase shift • Ex: sin (x – 4) is a shift to the right 4 units • Cos (x + pi) is a shift to the left pi units
The Constant D • The constant D results in a vertical shift D units up / down • Ex: y = sin x + 1 shifts up 1 unit • Ex: y = cos x – 4 shifts down 4 units • Notice no parenthesis
Combined Transformations • When working with multiple transformations, we want to rewrite the functions • This helps you see the phase shift
How to graph • 1) determine the period, amplitude, and shifts • 2) graph and shift the period, and split it into 4 regions • 3) plot a point in between each region, including the amplitude and shifts in your calculations • 4) connect the points in the correct sine or cosine wave
Ex • Sketch a graph of
Ex • Sketch a graph of
Closure • Graph • HW: p.523 #1-25 odds
5.6 Transformations of Sine and Cosine cont’dTues Feb 4 • Do Now • Graph the following • 1) y = sin(1/2 x)] • 2) y = - 2cos( 2x )
Review of Sine and Cosine • Recall the transformations • A affects the amplitude • B affects the period • C/B affects the phase shift • D affects the vertical shift
Ex • Graph
Matching • On p.522
Closure • What kind of transformations can affect the sine and cosine graphs? How do we determine what transformations occur? • HW: p.523 #27-43 odds
5.6 Addition and Multiplication of OrdinatesWed Feb 5 • Do Now • Graph
Graphs of Sums: Additions of Ordinates • When graphing a sum of 2 trigonometric functions, we use a strategy called addition of ordinates
Properties of sums • The period of a sum will be the least common multiple of every period • Graph each important point by adding the y-values of each trig function
ex • Graph y = 2sin x + sin 2x
Damped Oscillation: Multiplication of Ordinates • We’ll just graph these
Finding zeros (review) • To find zeros of a function, • 1) Graph function • 2) 2nd -> calc -> zeros • 3) Left bound – pick a point slightly left of the zero you want • 4) Right bound – pick a point slight right of the zero you want • 5) Guess – hit enter
ex • Solve the zeros of on the interval [-12,12]
closure • What is addition of ordinates? How do we graph these functions? • HW: p.524 #45-73 odds
5.6 Other Trig TransformationsThurs Feb 6 • Do Now • Graph y = csc x and y = tan x on your calculator
Review: f(x) = tan x and cot x • The period of tangent and cotangent is pi • Each period is separated by vertical asymptotes • Amplitude does not affect the graph drastically
Basic graphs • Y = tan x y = cot x
Review: f(x) = csc x and sec x • The period of csc x and sec x is 2pi • Vertical asymptotes occur every half period • The amplitude represents how close to the center each curve gets
Basic Graphs • Y = csc x y = sec x
Transformations • Transformations affect these 4 graphs the same way
Ex • Sketch the graph of
Ex • Sketch the graph of
Closure • Graph • HW: p. 525 #89-97 odds • CH 5 Test Wed and Thurs 02/12 and 02/13
5.6 ReviewFri Feb 7 • Do Now • Sketch the graph of
Transformations Review • Basic graphs • Transformations • Period, Amplitude, Phase shift, Vertical shift
Closure • What are some identifying properties of trigonometric functions and their graphs? • SGO Assessment Wed Feb 12 • Ch 5 Test Thurs Feb 13