Download
1 / 9
100 likes | 286 Vues
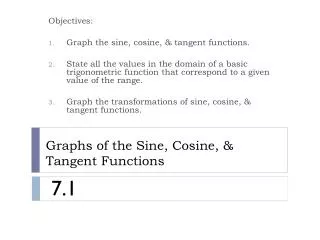
3.3 Graphs of the Sine and Cosine Functions. The sine function. The cosine function. Graphs of y = Asin(Bx + C) = Asin[B(x + C/B)] and y = Acos(Bx + C) = Acos[B(x + C/B)] The graphs have amplitude A height of the “wave” period 2 / B phase shift C / B.

E N D
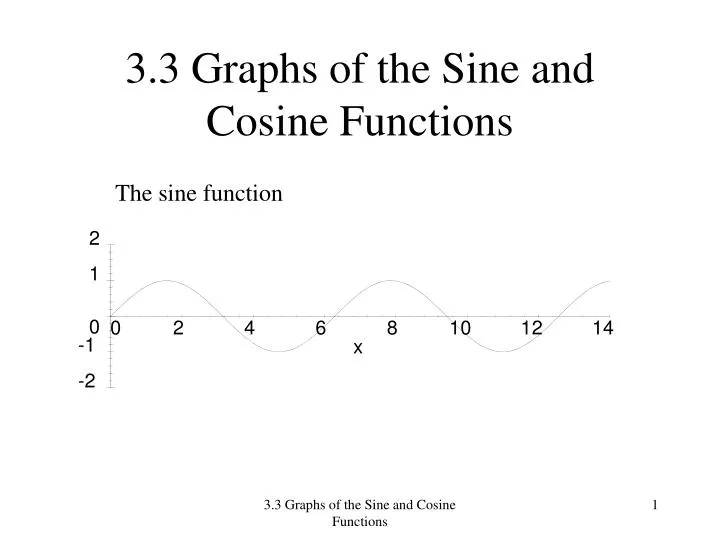
3.3 Graphs of the Sine and Cosine Functions The sine function 3.3 Graphs of the Sine and Cosine Functions
The cosine function 3.3 Graphs of the Sine and Cosine Functions
Graphs of y = Asin(Bx + C) = Asin[B(x + C/B)] and y = Acos(Bx + C) = Acos[B(x + C/B)] The graphs have amplitude A height of the “wave” period 2 / B phase shift C / B 3.3 Graphs of the Sine and Cosine Functions
Exercisespage 212 Problem 4 Problem 12 Problem 16 Problem 20 Problem 28 Problem 38 Problem 44 3.3 Graphs of the Sine and Cosine Functions
Problem 4 3.3 Graphs of the Sine and Cosine Functions
Problem 12 3.3 Graphs of the Sine and Cosine Functions
Problem 16 3.3 Graphs of the Sine and Cosine Functions
Problem 38 3.3 Graphs of the Sine and Cosine Functions
Problem 44 a and b 3.3 Graphs of the Sine and Cosine Functions