Download

1 / 21
230 likes | 468 Vues
4.5 Graphs of Sine and Cosine FUNctions. How can I sketch the graphs of sine and cosine FUNctions?. Basic Sine and Cosine Curves. y = sin x y = cos x. Let’s look at the five key points on one period of a sine graph. Maximum: ( π /2,1). Intercept: ( π ,0). Intercept: (0,0).

E N D
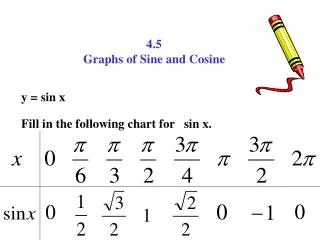
4.5 Graphs of Sine and Cosine FUNctions How can I sketch the graphs of sine and cosine FUNctions?
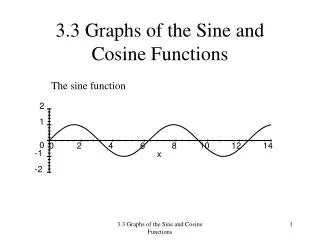
Basic Sine and Cosine Curves y = sin x y = cos x
Let’s look at the five key points on one period of a sine graph Maximum: (π/2,1) Intercept: (π,0) Intercept: (0,0) Intercept: (2π,0) Minimum: (3π/2,-1)
Let’s look at the five key points on one period of a cosine graph Maximum: (0,1) Intercept: (3π/2,0) Maximum: (2π,1) Intercept: (π/2,0) Minimum: (π,-1)
For the rest of this section, we will apply the concepts we learned way back in section 1.5 to the trigonometric FUNctions.
Amplitude and Period of Sine FUNctions amplitude (new word, old concept) – the maximum displacement from equilibrium. For y = asinx and y = acosx, the amplitude is a.
Let’s graph y = 2sinx. • First, we will graph y = sinx.
Maximum: (π/2,2) • Next, we will label the five new key points, and graph the new FUNction. Intercept: (π,0) Intercept: (0,0) Minimum: (3π/2,-2) Intercept: (2π,0)
Notes: • The period of a FUNction is 2π/b. • y = asinbx and y = acosbx complete one period from 0/b to 2π/b.
Let’s graph y = cos(2x). • First, we will graph y = cosx.
Maximum: (0,1) • Next, we will label the five new key points, and graph the new FUNction. Maximum: (π,1) Intercept: (3π/4,0) Intercept: (π/4,0) Minimum: (π/2,-1)
Translations of Sine and Cosine Curves • Sine and cosine graphs of the form have a directed horizontal shift of c/b • In other words, to find the right and left x-coordinates of your key points for one cycle, please solve bx – c = 0 bx – c = 2π
Let’s graph y = 2sin(2x + π/2) • Our y-values are easy. We just take the original y-coordinates and multiply by 2. We’ll work on the y’s. • Okay…. Let’s find our new endpoints: 2x + π/2 = 0 2x + π/2 = 2π x = -π/4 x = 3π/4 • Now, we will divide the interval into four equal parts (HINT: Find the average of the x-coordinates of your endpoints, then average that value with each endpoint.)
Key Points • (-π/4,0) • (0,2) • (π/4,0) • (π/2,-2) • (3π/4,0)
Good news! • Vertical shifts are easy! We just shift up or down after we are finished with everything else. • In other words, find your five key points, then change the y-values to account for the shift.
Try one on your own! y = 1 – 0.5sin(0.5x – π)
Mathematical Modeling • The average monthly temperatures of a certain southern city can be modeled by T = 74.6 + 12.87sin(0.52t – 2.09). where T is the average monthly temperature and t is the month with t = 1 corresponding to January. Please use this model to predict the average monthly temperature in June. T ≈ 85.63°