Download
1 / 22
240 likes | 419 Vues
4.5 Graphs of Sine and Cosine Functions. In this lesson you will learn to graph functions of the form

E N D
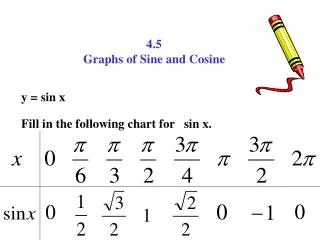
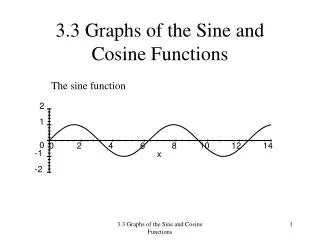
In this lesson you will learn to graph functions of the form y= a sin bx and y = a cos bx where a and b are positive constants and x is in radian measure. The graphs of all sine and cosine functions are related to the graphs of y = sin x and y = cos x which are shown below. y = sin x y = cos x
Fill in the chart. x Sin x Cos x These will be key points on the graphs of y = sin x and y = cos x.
2. The range is the set of y values such that . 5. Each function cycles through all the values of the range over an x-interval of . Properties of Sine and Cosine Functions The graphs of y = sin x and y = cos x have similar properties: 1. The domain is the set of real numbers. 3. The maximum value is 1 and the minimum value is –1. 4. The graph is a smooth curve. 6. The cycle repeats itself indefinitely in both directions of thex-axis.
x 0 sin x 0 1 0 -1 0 y = sin x y x Graph of the Sine Function To sketch the graph of y = sin x first locate the key points.These are the maximum points, the minimum points, and the intercepts. Then, connect the points on the graph with a smooth curve that extends in both directions beyond the five points. A single cycle is called a period.
x 0 cos x 1 0 -1 0 1 y = cos x y x Graph of the Cosine Function To sketch the graph of y = cos x first locate the key points.These are the maximum points, the minimum points, and the intercepts. Then, connect the points on the graph with a smooth curve that extends in both directions beyond the five points. A single cycle is called a period.
Before sketching a graph, you need to know: • Amplitude – Constant that gives vertical stretch or shrink. • Period – • Interval – Divide period by 4 • Critical points – You need 5.(max., min., intercepts.)
Interval Amplitudes and Periods The graph of y = A sin Bx has amplitude = | A| period = To get your critical points (max, min, and intercepts) just take your period and divide by 4. Example:
y y = 2sin x x y = sin x y = sin x y = –4 sin x reflection ofy = 4 sin x y = 4sin x The amplitude of y = a sin x (or y = a cos x) is half the distance between the maximum and minimum values of the function. amplitude = |a| If |a| > 1, the amplitude stretches the graph vertically. If 0 < |a| < 1, the amplitude shrinks the graph vertically. If a < 0, the graph is reflected in the x-axis. Notice that since all these graphs have B=1, so the period doesn’t change.
For b 0, the period of y = a sin bx is . For b 0, the period of y = a cos bx is also . period: period: 2 y x y period: 2 x period: 4 The period of a function is the x interval needed for the function to complete one cycle. If b > 1, the graph of the function is shrunk horizontally. If 0 < b < 1, the graph of the function is stretched horizontally.
x 0 2 3 0 -3 0 3 y = 3 cos x max x-int min x-int max y (0, 3) ( , 3) x ( , 0) ( , 0) ( , –3) Example 1: Sketch the graph of y = 3 cos x on the interval [–, 4]. Partition the interval [0, 2] into four equal parts. Find the five key points; graph one cycle; then repeat the cycle over the interval.
Example 2 Determine the amplitude of y = 1/2 sin x. Then graph y = sin x and y = 1/2 sin x for 0 <x< 2.
y y = sin x 1 y = 1/2sinx 2˝ x ˝ -1
For the equationsy = a sin(bx-c)+d and y = a cos(bx-c)+d • a represents the amplitude. This constant acts as a scaling factor – a vertical stretch or shrink of the original function. • Amplitude = • The period is the sin/cos curve making one complete cycle. • Period = • c makes a horizontal shift. • d makes a vertical shift. • The left and right endpoints of a one-cycle interval can be determined by solving the equations bx-c=0 and bx-c=
Tides • Throughout the day, the depth of the water at the end of a dock in Bangor, Washington varies with the tides. The tables shows the depths (in feet) at various times during the morning. • Use a trig function to model the data. • A boat needs at least 10 feet of water to moor at the dock. During what times in the evening can it safely dock?
Homework • Page 304-305 • 3-13 odd, 15-21 odd, 31 – 34 all, 47-57 odd, 65, 67