Download

1 / 14
150 likes | 389 Vues
Applied Hydrology Design Storm Hyetographs. Prof. Ke-Sheng Cheng Department of Bioenvironmental Systems Engineering National Taiwan University. Introduction.

E N D
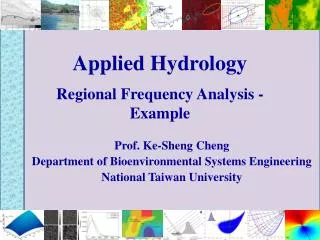
Applied HydrologyDesign Storm Hyetographs Prof. Ke-Sheng Cheng Department of Bioenvironmental Systems Engineering National Taiwan University
Introduction • The design storm hyetograph, i.e. time distribution of the total storm depth, plays an essential role in water resources planning and stormwater management design. • Given a hyetograph model, design storm hyetographs can be developed for locations where sufficient rainfall data are available. For areas without sufficient rainfall data, or for major projects that involve large watershed area, regional hyetographs are necessitated.
Hyetographs are storm-type specific. For examples, hyetographs of the convective and cyclonic storms are different. • Design storm hyetographs need to be established in accordance with the dominant storm types associated with design rainfall depths. • Hyetographs of real storm events vary from one storm event to another. Lab for Remote Sensing Hydrology and Spatial Modeling, Dept. of Bioenvironmental Systems Eng., NTU
Hyetograph models • The alternating block model • The average rank model • The SSGM model
The Alternating Block Model • Calculate the total storm depth D from the IDF relationship • Determine the incremental time interval to be used for total rainfall apportionment. The total number of incremental rainfalls of the design storm is Lab for Remote Sensing Hydrology and Spatial Modeling, Dept. of Bioenvironmental Systems Eng., NTU
Calculate the average intensity and total depth of design storms with a fixed return period T but variable durations k=1, 2, …, n-1 • Calculate the total rainfall difference between design storms of consecutive durations. Lab for Remote Sensing Hydrology and Spatial Modeling, Dept. of Bioenvironmental Systems Eng., NTU
Form a ranked data series of incremental rainfall depth by ranking the incremental rainfall depth in descending order, i.e., Lab for Remote Sensing Hydrology and Spatial Modeling, Dept. of Bioenvironmental Systems Eng., NTU
Assign to the most central interval, and to its right (or left) and left (or right), respectively. Other remaining incremental rainfalls in the ranked series are sequentially allocated in a similar alternating manner. • The alternating block hyetograph is developed without considering the characteristics of real storm events. • This model does not use rainfall data of real storm events and is duration and return period specific. Lab for Remote Sensing Hydrology and Spatial Modeling, Dept. of Bioenvironmental Systems Eng., NTU
Lab for Remote Sensing Hydrology and Spatial Modeling, Dept. of Bioenvironmental Systems Eng., NTU
The Average Rank Model • Pilgrim and Cordery (1975) • Gather rainfall data of several largest storms of a pre-specified duration. • The pre-specified duration is divided into a number of equal time intervals, which are usually determined by considering the minimum time period of the subsequent rainfall-runoff modeling. Lab for Remote Sensing Hydrology and Spatial Modeling, Dept. of Bioenvironmental Systems Eng., NTU
Rank time intervals for each event according to the rainfall depth in each interval. The average ranking for each time interval is calculated using all events. • Average rankings are likely to be non-integer and are used to give an assigned rank to each time interval. Lab for Remote Sensing Hydrology and Spatial Modeling, Dept. of Bioenvironmental Systems Eng., NTU
Determine the percentage of total rainfall for each event in each of the ranked time interval for that event. Average rainfall percentages for time intervals of rank 1, 2, 3,… for all events are calculated. • Assign the average rainfall percentage of each rank to time interval of the same assigned rank. Lab for Remote Sensing Hydrology and Spatial Modeling, Dept. of Bioenvironmental Systems Eng., NTU
The average rank model is duration-specific and requires rainfall data of storm events of the same pre-specified duration. Since storm duration varies significantly, it may be difficult to gather enough number of storm events of the same duration. Lab for Remote Sensing Hydrology and Spatial Modeling, Dept. of Bioenvironmental Systems Eng., NTU
Lab for Remote Sensing Hydrology and Spatial Modeling, Dept. of Bioenvironmental Systems Eng., NTU