Download
1 / 32
390 likes | 2.21k Vues
Hyetographs & Hydrographs. Objectives. Understand what a hyetograph represents Understand what a hydrograph represents Understand what a unit hydrograph represents Know how unit hydrographs can be used to develop various hydrographs. Hyetograph.

E N D
Objectives • Understand what a hyetograph represents • Understand what a hydrograph represents • Understand what a unit hydrograph represents • Know how unit hydrographs can be used to develop various hydrographs
Hyetograph • Graphical representation of time (usually hrs) vs rainfall (“) or intensity (“/hr)
Rainfall • Abstraction--------rainfall lost • evaporation • infiltration • depression storage • Excess------rainfall which runs off
Rainfall Intensity • Usually varies over storm duration
Area under the hyetograph • Represents total amount of precipitation dropped by the storm over its duration • Sum total inches or • Sum (intensity*time intervals)
To Calculate Runoff Volume • Total runoff * Drainage Area • 1” of excess rain over 1 acre represents 3,630 cubic feet = 27,154 gallons
Mass Hyetograph • Another way to represent a hyetograph is a mass curve (accumulated time versus accumulated rainfall) • Rainfall ratio (inches/total inches) • Time ratio (time/total time)
Question • What do the slopes of mass hyetographs represent?
Area I-Alaska, Hawaii, Southern CA Area IA-Pacific Northwest Area II-Most of the US Area III-Gulf & Eastern Coast
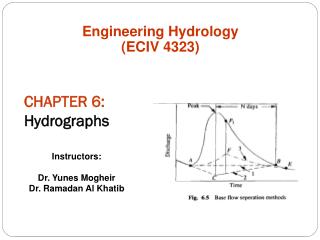
Hydrograph • Graphical representation of time (hours) versus discharge (cfs or cms) at a particular point on a stream or channel which drains the watershed area
Hydrograph • Shape represents basin characteristics • Area • Shape • Stream pattern • Land/channel properties/slopes • Infiltration capacity
Hydrograph • Represents rainfall that runs off into the stream (rainfall-excess or direct runoff) • Base flow (from groundwater) is not part of the hydrograph
Hydrograph • Rising Limb • Crest Segment • Falling Limb (Recession Curve)
Hydrograph-Definitions • Lag Time • Time interval from the center of mass of the rainfall-excess to the peak of the resultant hydrograph • Time to Peak • Time interval from the start of the rainfall-excess to the peak of the resultant hydrograph • Rainfall Duration • Time interval from the start to the end of rainfall-excess • Time of Concentration • Time interval from the end of the rainfall-excess to the point of inflection on the hydrograph recession curve or • Time required for runoff to travel from the hydraulically most distant point on the watershed to the point of interest
Hydrograph • Associated with the time duration and frequency of the rainfall-excess producing it • If the duration D of the rainfall-excess is 30 minutes and the frequency is 2 years, the hydrograph is referred to as a 30-minute, 2-year frequency hydrograph
Hydrograph • Area under the hydrograph represents a volume of water (total volume of rainfall that fell on the basin and appeared as runoff) • If the area under the hydrograph represents 1 inch (or 1 cm) of rainfall-excess over the entire drainage basin then the hydrograph is called a UNIT hydrograph
Unit Hydrograph-Assumptions • Identical rainfalls with the same antecedent conditions produce identical hydrographs • The time bases of all hydrograph from rainfalls of the same duration with the same antecedent conditions are equal • Superposition: If the storm duration is the same, the hydrograph of a 2” storm is twice the amount of a 1” storm.
Example • After a 2-hour storm, a station downstream from a 45 square mile drainage basin measures 9400 cfs as a peak discharge and 3300 acre-feet as total runoff. a) Find the 2-hour unit hydrograph peak discharge. b) What would be the peak runoff and design flood volume if a 2-hour storm dropped 2.5 inches of net precipitation?
a) Find Unit Hydrograph Peak Flow • Find volume of runoff which represents 1” of excess runoff over the 45 square mile drainage area • 45 square miles * 1” = 2400 acre-ft • Since the actual measured 3,300 acre-ft is greater than the 2400 acre-ft for 1” of runoff, the storm had more than 1” of excess runoff
a) Find Unit Hydrograph Peak Flow • The ratio of 3300/2400=1.375; therefore the storm had 1.375” of excess runoff • If the peak discharge is 9400 cfs for a runoff of 1.375” then the ratio of the peak discharge of the unit hydrograph must be: • 2400/3300 (or 1/1.375) = 0.727 • Peak discharge=0.727*9400 = 6,800 cfs
b) Find Qpeak & Roff of 2.5” storm • Once you know the peak flow and runoff volume that represents 1” of excess rainfall, then you just use ratios: • 2.5*6,800 cfs= 17,000 cfs • 2.5*2400 acre-ft = 6,000 acre-ft
Use of Hydrographs • Development can cause less infiltration and more runoff. In addition, runoff velocities increase because of smoother surfaces. • The net effect is that development can increase peak flow, resulting in inadequately sized drainage structures • Most stormwater management regulations require that post-development peak runoff rates be equal to or less than the predevelopment peak runoff rates • This can be done by constructing detention basins which temporarily store the water • Hydrographs are used to design detention basins (time is an issue) • Sometimes, only the peak runoff flow is needed.
Hydrographs • From rainfall data (not typical) • Synthetic • TR-55 • Snyder • Simple Triangular • Modified Rational Method
Error in Book V3: Example 10-3 Area calculated is apparently for the unit hydrograph (not the 5.5” hydrograph). Therefore they should have divided by 1” (instead of 5.5”). Answer should be approx. 42 acres.
Next Lecture • More hydrographs • Subtract groundwater • Synthesize unit hydrographs for different storm durations using the: • Lagging storm method • S-Curve method