Download
1 / 204
2.11k likes | 2.79k Vues
Applied Hydrology Hydrological Frequency Analysis. Prof. Ke-Sheng Cheng Department of Bioenvironmental Systems Engineering National Taiwan University. Outline. Introductory thoughts General interpretation of hydrological frequency analysis The general equation of frequency analysis

E N D
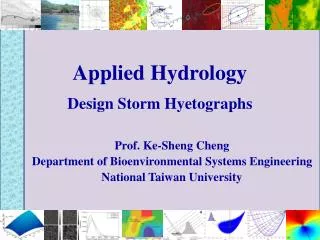
Applied HydrologyHydrological Frequency Analysis Prof. Ke-Sheng Cheng Department of Bioenvironmental Systems Engineering National Taiwan University
Outline • Introductory thoughts • General interpretation of hydrological frequency analysis • The general equation of frequency analysis • Data series for frequency analysis • Parameter estimation • Techniques for GOF tests • The Horner’s equation • Further discussions • More advanced topics Lab for Remote Sensing Hydrology and Spatial Modeling, Dept. of Bioenvironmental Systems Eng., NTU
Introductory thoughts • Scientific perspective • Joint distribution of storm duration and event-total depth • Engineering perspective • Event-total depths of selected design durations • The concept of design storms • Duration • Return period (not “recurrence interval”) • Choice of return period resolution. Lab for Remote Sensing Hydrology and Spatial Modeling, Dept. of Bioenvironmental Systems Eng., NTU
Bivariate frequency analysis • What is the return period of a storm with observed duration and event-total depth? • Connection between bivariate frequency analysis and conditional (duration-specific) frequency analysis. Lab for Remote Sensing Hydrology and Spatial Modeling, Dept. of Bioenvironmental Systems Eng., NTU
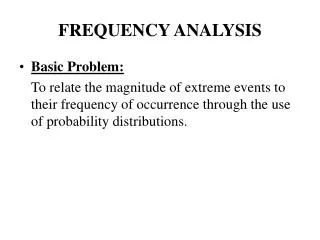
General interpretation of hydrological frequency analysis • Hydrological frequency analysis is the work of determining the magnitude of hydrological variables that corresponds to a given probability of exceedance. Frequency analysis can be conducted for many hydrological variables including floods, rainfalls, and droughts. • The work can be better perceived by treating the interested variable as a random variable. Lab for Remote Sensing Hydrology and Spatial Modeling, Dept. of Bioenvironmental Systems Eng., NTU
Let X represent the hydrological (random) variable under investigation. A value xc associating to some event is chosen such that if X assumes a value exceeding xc the event is said to occur. Every time when a random experiment (or a trial) is conducted the event may or may not occur. • We are interested in the number of Bernoulli trials in which the first success occur. This can be described by the geometric distribution. Lab for Remote Sensing Hydrology and Spatial Modeling, Dept. of Bioenvironmental Systems Eng., NTU
Geometric distribution • Geometric distribution represents the probability of obtaining the first success in x independent and identical Bernoulli trials. Lab for Remote Sensing Hydrology and Spatial Modeling, Dept. of Bioenvironmental Systems Eng., NTU
Lab for Remote Sensing Hydrology and Spatial Modeling, Dept. of Bioenvironmental Systems Eng., NTU
Average number of trials to achieve the first success. Recurrence interval vs return period Lab for Remote Sensing Hydrology and Spatial Modeling, Dept. of Bioenvironmental Systems Eng., NTU
Lab for Remote Sensing Hydrology and Spatial Modeling, Dept. of Bioenvironmental Systems Eng., NTU
The general equation of frequency analysis Lab for Remote Sensing Hydrology and Spatial Modeling, Dept. of Bioenvironmental Systems Eng., NTU
Lab for Remote Sensing Hydrology and Spatial Modeling, Dept. of Bioenvironmental Systems Eng., NTU
It is apparent that calculation of involves determining the type of distribution for X and estimation of its mean and standard deviation. The former can be done by GOF tests and the latter is accomplished by parametric point estimation. • Collecting required data. • Estimating the mean, standard deviation and coefficient of skewness. • Determining appropriate distribution. • Calculating xT using the general eq. Lab for Remote Sensing Hydrology and Spatial Modeling, Dept. of Bioenvironmental Systems Eng., NTU
Data series for frequency analysis • Complete duration series • A complete duration series consists of all the observed data. • Partial duration series • A partial duration series is a series of data which are selected so that their magnitude is greater than a predefined base value. If the base value is selected so that the number of values in the series is equal to the number of years of the record, the series is called an “annual exceedance series”. Lab for Remote Sensing Hydrology and Spatial Modeling, Dept. of Bioenvironmental Systems Eng., NTU
Extreme value series • An extreme value series is a data series that includes the largest or smallest values occurring in each of the equally-long time intervals of the record. If the time interval is taken as one year and the largest values are used, then we have an “annual maximum series”. • Data independency • Why is it important? Annual exceedance series and annual maximum series are different. Lab for Remote Sensing Hydrology and Spatial Modeling, Dept. of Bioenvironmental Systems Eng., NTU
Parameter estimation • Method of moments • Maximum likelihood method • Depending on the distribution types, parameter estimation may involve estimation of the mean, standard deviation and/or coefficient of skewness. • Parameter estimation exemplified by the gamma distribution. Lab for Remote Sensing Hydrology and Spatial Modeling, Dept. of Bioenvironmental Systems Eng., NTU
Gamma distribution parameter estimation • Gamma distribution is a special case of the Pearson type III distribution (with zero location parameter). • Gamma density where , , and are the mean, standard deviation, and coefficient of skewness of X (or Y), respectively, and and are respectively the scale and shape parameters of the gamma distribution. Lab for Remote Sensing Hydrology and Spatial Modeling, Dept. of Bioenvironmental Systems Eng., NTU
MOM estimators Lab for Remote Sensing Hydrology and Spatial Modeling, Dept. of Bioenvironmental Systems Eng., NTU
Maximum likelihood estimator Lab for Remote Sensing Hydrology and Spatial Modeling, Dept. of Bioenvironmental Systems Eng., NTU
Lab for Remote Sensing Hydrology and Spatial Modeling, Dept. of Bioenvironmental Systems Eng., NTU
Lab for Remote Sensing Hydrology and Spatial Modeling, Dept. of Bioenvironmental Systems Eng., NTU
Evaluating bias of different estimators of coefficient of skewness Lab for Remote Sensing Hydrology and Spatial Modeling, Dept. of Bioenvironmental Systems Eng., NTU
Evaluating mean square error of different estimators of coefficient of skewness Lab for Remote Sensing Hydrology and Spatial Modeling, Dept. of Bioenvironmental Systems Eng., NTU
Lab for Remote Sensing Hydrology and Spatial Modeling, Dept. of Bioenvironmental Systems Eng., NTU
Lab for Remote Sensing Hydrology and Spatial Modeling, Dept. of Bioenvironmental Systems Eng., NTU
Techniques for goodness-of-fit test • A good reference for detailed discussion about GOF test is: Goodness-of-fit Techniques. Edited by R.B. D’Agostino and M.A. Stephens, 1986. • Probability plotting • Chi-square test • Kolmogorov-Smirnov Test • Moment-ratios diagram method • L-moments based GOF tests Lab for Remote Sensing Hydrology and Spatial Modeling, Dept. of Bioenvironmental Systems Eng., NTU
Probability plotting • Fundamental concept • Probability papers • Empirical CDF vs theoretical CDF • Example of misuse of probability plotting Lab for Remote Sensing Hydrology and Spatial Modeling, Dept. of Bioenvironmental Systems Eng., NTU
Suppose the true underlying distribution depends on a location parameter and a scale parameter (they need not to be the mean and standard deviation, respectively). The CDF of such a distribution can be written as where Z is referred to as the standardized variable and G(z) is the CDF of Z. Lab for Remote Sensing Hydrology and Spatial Modeling, Dept. of Bioenvironmental Systems Eng., NTU
Also let Fn(X) represents the empirical cumulative distribution function (ECDF) of X based on a random sample of size n. A probability plot is a plot of on x where x represents the observed values of the random variable X. Lab for Remote Sensing Hydrology and Spatial Modeling, Dept. of Bioenvironmental Systems Eng., NTU
Lab for Remote Sensing Hydrology and Spatial Modeling, Dept. of Bioenvironmental Systems Eng., NTU
Most of the plotting position methods are empirical. If n is the total number of values to be plotted and m is the rank of a value in a list ordered by descending magnitude, the exceedence probability of the mth largest value, xm, is , for large n, shown in the following table. Lab for Remote Sensing Hydrology and Spatial Modeling, Dept. of Bioenvironmental Systems Eng., NTU
Lab for Remote Sensing Hydrology and Spatial Modeling, Dept. of Bioenvironmental Systems Eng., NTU
Misuse of probability plotting Log Pearson Type III ? Lab for Remote Sensing Hydrology and Spatial Modeling, Dept. of Bioenvironmental Systems Eng., NTU
Misuse of probability plotting 48-hr rainfall depth Log Pearson Type III ? Lab for Remote Sensing Hydrology and Spatial Modeling, Dept. of Bioenvironmental Systems Eng., NTU
Fitting a probability distribution to annual maximum series (Non-parametric GOF tests) • How do we fit a probability distribution to a random sample? • What type of distribution should be adopted? • What are the parameter values for the distribution? • How good is our fit? Lab for Remote Sensing Hydrology and Spatial Modeling, Dept. of Bioenvironmental Systems Eng., NTU
Chi-square GOF test Lab for Remote Sensing Hydrology and Spatial Modeling, Dept. of Bioenvironmental Systems Eng., NTU
Lab for Remote Sensing Hydrology and Spatial Modeling, Dept. of Bioenvironmental Systems Eng., NTU
Lab for Remote Sensing Hydrology and Spatial Modeling, Dept. of Bioenvironmental Systems Eng., NTU
Lab for Remote Sensing Hydrology and Spatial Modeling, Dept. of Bioenvironmental Systems Eng., NTU
Lab for Remote Sensing Hydrology and Spatial Modeling, Dept. of Bioenvironmental Systems Eng., NTU
Lab for Remote Sensing Hydrology and Spatial Modeling, Dept. of Bioenvironmental Systems Eng., NTU
Lab for Remote Sensing Hydrology and Spatial Modeling, Dept. of Bioenvironmental Systems Eng., NTU
Kolmogorov-Smirnov GOF test • The chi-square test compares the empirical histogram against the theoretical histogram. • In contrast, the K-S test compares the empirical cumulative distribution function (ECDF) against the theoretical CDF. Lab for Remote Sensing Hydrology and Spatial Modeling, Dept. of Bioenvironmental Systems Eng., NTU
Lab for Remote Sensing Hydrology and Spatial Modeling, Dept. of Bioenvironmental Systems Eng., NTU
Lab for Remote Sensing Hydrology and Spatial Modeling, Dept. of Bioenvironmental Systems Eng., NTU
Lab for Remote Sensing Hydrology and Spatial Modeling, Dept. of Bioenvironmental Systems Eng., NTU
In order to measure the difference between Fn(X) and F(X), ECDF statistics based on the vertical distances between Fn(X) and F(X) have been proposed. Lab for Remote Sensing Hydrology and Spatial Modeling, Dept. of Bioenvironmental Systems Eng., NTU
Lab for Remote Sensing Hydrology and Spatial Modeling, Dept. of Bioenvironmental Systems Eng., NTU
Lab for Remote Sensing Hydrology and Spatial Modeling, Dept. of Bioenvironmental Systems Eng., NTU
Lab for Remote Sensing Hydrology and Spatial Modeling, Dept. of Bioenvironmental Systems Eng., NTU