Download
1 / 20
200 likes | 310 Vues
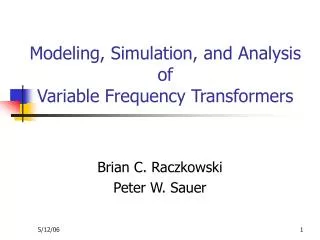
Variable-Step Frequency Integration in the Decade/Century-Band Imaging. 2010 Nov 4-5 SKA Japan Workshop @ Mitaka Tomoharu Kurayama (Kagoshima Univ.). Abstract. In decade/century-band imaging, we have a problem in the frequency integration.

E N D
Variable-Step Frequency Integration in the Decade/Century-Band Imaging 2010 Nov 4-5 SKA Japan Workshop @ Mitaka Tomoharu Kurayama (Kagoshima Univ.) SKA Japan Workshop
Abstract In decade/century-band imaging, we have a problem in the frequency integration. We propose the variable-step frequency integration in order to minimize this problem. From the simple simulation, synthesized beams and images become more sharp in the variable-step frequency integration. SKA Japan Workshop
Synthesis Imaging • Visibilities • (Observables) • Image • Fourier Transform I(l,m) V(u,v) dec m l v u RA • (Taylor, Carilli & Perleyed. 1999) Synthesized images are Fourier transforms of visibilities on (u, v) planes. SKA Japan Workshop
Integration for Weak Sources • sensitivity • Integration of images • Integration of visibilities V3(u,v) I3(l,m) V2(u,v) I2(l,m) V1(u,v) I1(l,m) dec m l v u frequency RA frequency We can detect low-flux sources by integrating frequency points. SKA Japan Workshop
Current Data Analysis Making images with Fourier transform V3(u,v) V(u,v) V2(u,v) I(l,m) V1(u,v) dec m v l u v u RA Frequency-integrated visibilities Images frequency Integrating frequency points of visibilities SKA Japan Workshop
What is (u, v)? • observing source • w-direction • Ly • v-direction • Lx • earth • u-direction • (u, v)s depend on frequencies! (u, v) : Projected baseline lengths in the unit of wavelengths SKA Japan Workshop
Problem in Decade/Century Bands • Decade band • 22 GHz • 10 GHz • Bandwidth ~ 0.25 GHz • integrating area • 1 GHz • We can NOT ignore the effect of bandwidth in the case of decade/century band. e.g.) VERA SKA Japan Workshop
Visibility Gridding • gridding • When the point distribution is more uniform, • We can get more points in the process of gridding, and • The quality of image becomes more sharp. • Requirement of FFT : • Data points are on rectangular grids • We need ‘gridding’ before Fourier transform SKA Japan Workshop
(u, v) Loci and Frequency Step • The numbers of points are same for both loci. • The point distribution is more uniform when • length • area • Frequency : • : • : • Frequency : (u, v) change with the earth’s spin. The loci are ellipse if we can observe 24 hours. SKA Japan Workshop
Simple Simulation • uv loci of one baseline, one frequency point • ~ 180 km • 12 stations • ~ 500 km • 12 stations • ~ 5 km • 30o S • 24 stations • north • Considering SKA… • Band : 1 – 10 GHz • 10-hour observation • Time step : 48 s • 48 stations SKA Japan Workshop
(u, v) Loci of One Baseline SKA Japan Workshop
(u, v) Loci of All Baselines SKA Japan Workshop
Sampled Grids • 1024 grids • 462382 grids • 1024 grids • 758383 grids • Total : 1048576 grids SKA Japan Workshop
Synthesized Beam • 0.371 • 0.235 • 0.109 • 0.122 • ~ 14 pixels • ~ 14 pixels • Width of main beam is smaller. • First sidelobe is slightly higher. SKA Japan Workshop
Imaging Simulation : Method • model visibilities • 0 • 0 • 0 • 0 • model image • inverse Fourier transform • 0 • FT • 0 • observed image • 0 • 0 • 0 • 0 • 0 • 0 • 0 • 0 Making model visibilities with Fourier transform Picking up the grids covered by (u, v) loci Getting simulated images with inverse transform SKA Japan Workshop
Imaging Simulation : Result (1) • model image • 1024 pixels • 1024 pixels • 1024 pixels SKA Japan Workshop
Imaging Simulation : Result (2) • 100 pixels • model image SKA Japan Workshop
Imaging Simulation : Result (3) • 25 pixels • model image SKA Japan Workshop
Summary • We have proposed a new type of frequency integration for decade/century-band imaging. • Setting the frequency step as • From a simple simulation, we have found • The sampled points distribute more uniformly on (u, v) plane • Synthesized beams and images become more sharp SKA Japan Workshop
Thank you! • 2010 Oct 24 Triathlon in Tokunoshima • (swim 2 km / bike 75 km / run 21 km) SKA Japan Workshop