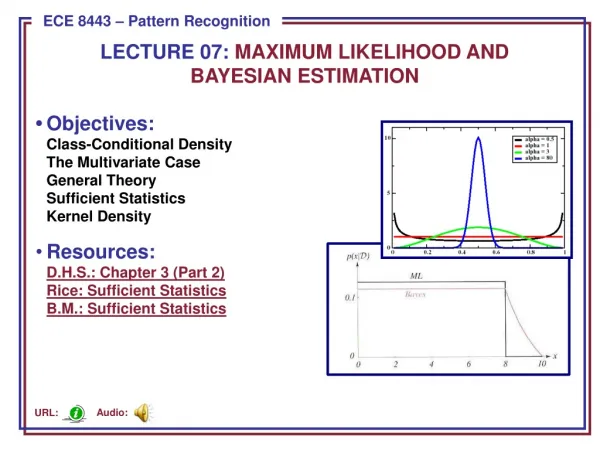
Download
1 / 19
200 likes | 215 Vues
Statistical inference: distribution, hypothesis testing. Distribution of a correlation coefficient? Computer simulation…. 1. Specify the true correlation coefficient Correlation coefficient = 0.15 2. Select a random sample of 100 virtual men from the population.

E N D
Distribution of a correlation coefficient? Computer simulation… • 1. Specify the true correlation coefficient • Correlation coefficient = 0.15 • 2. Select a random sample of 100 virtual men from the population. • 3. Calculate the correlation coefficient for the sample. • 4. Repeat steps (2) and (3) 15,000 times • 5. Explore the distribution of the 15,000 correlation coefficients.
Distribution of a correlation coefficient… Normally distributed! Mean = 0.15 (true correlation) Standard error = 0.10
Distribution of a correlation coefficient in general… • 1. Shape of the distribution • Normally distributed for large samples • T-distribution for small samples (n<100) • 2. Mean = true correlation coefficient (r) • 3. Standard error
Many statistics follow normal (or t-distributions)… • Means/difference in means • T-distribution for small samples • Proportions/difference in proportions • Regression coefficients • T-distribution for small samples • Natural log of the odds ratio
Mean + 2 Std error =68.6 Mean Mean - 2 Std error=55.4 Recall: 68-95-99.7 rule for normal distributions! These is a 95% chance that the sample mean will fall within two standard errors of the true mean To be precise, 95% of observations fall between Z=-1.96 and Z= +1.96 (so the “2” is a rounded number)…
95% confidence interval • Thus, for normally distributed statistics, the formula for the 95% confidence interval is: • sample statistic 2 x (standard error)
Vertical line indicates the true mean (62) Only 1 confidence interval missed the true mean. Simulation of 20 studies of 100 men… 95% confidence intervals for the mean vitamin D for each of the simulated studies.
The P-value P-value is the probability that we would have seen our data (or something more unexpected) just by chance if the null hypothesis (null value) is true. Small p-values mean the null value is unlikely given our data. Our data are so unlikely given the null hypothesis (<<1/10,000) that I’m going to reject the null hypothesis! (Don’t want to reject our data!)
P-value<.0001 means: The probability of seeing what you saw or something more extreme if the null hypothesis is true (due to chance)<.0001 P(empirical data/null hypothesis) <.0001
The P-value • By convention, p-values of <.05 are often accepted as “statistically significant” in the medical literature; but this is an arbitrary cut-off. • A cut-off of p<.05 means that in about 5 of 100 experiments, a result would appear significant just by chance (“Type I error”).
Summary: Hypothesis Testing The Steps: 1.Define your hypotheses (null, alternative) 2.Specify your null distribution 3.Do an experiment 4.Calculate the p-value of what you observed 5.Reject or fail to reject (~accept) the null hypothesis
Hypothesis Testing • Null hypothesis - Statement regarding the value(s) of unknown parameter(s). Typically will imply no association between explanatory and response variables in our applications (will always contain an equality) • Alternative hypothesis - Statement contradictory to the null hypothesis (will always contain an inequality) • Test statistic - Quantity based on sample data and null hypothesis used to test between null and alternative hypotheses • Rejection region - Values of the test statistic for which we reject the null in favor of the alternative hypothesis
Hypothesis Testing • Goal:Keep a, b reasonably small
Sampling Distribution of Difference in Means • In large samples, the difference in two sample means is approximately normally distributed: • Under the null hypothesis, m1-m2=0 and: • s12 and s22 are unknown and estimated by s12 and s22
Elements of a Hypothesis Test • Test Statistic - Difference between the Sample means, scaled to number of standard deviations (standard errors) from the null difference of 0 for the Population means: • Rejection Region - Set of values of the test statistic that are consistent with HA, such that the probability it falls in this region when H0 is true is a (we will always set a=0.05)
P-value (aka Observed Significance Level) • P-value - Measure of the strength of evidence the sample data provides against the null hypothesis: P(Evidence This strong or stronger against H0 | H0 is true)
2-Sided Tests • H0: m1-m2 = 0 HA: m1-m2 0 • Test statistic is the same as before • Decision Rule: • Conclude m1-m2 > 0 if zobs za/2 (a=0.05 za/2=1.96) • Conclude m1-m2 < 0 if zobs -za/2 (a=0.05 -za/2= -1.96) • Do not reject m1-m2 = 0 if -za/2 zobs za/2 • P-value: 2P(Z |zobs|)
Power of a Test • Power - Probability a test rejects H0 (depends on m1- m2) • H0 True: Power = P(Type I error) = a • H0 False: Power = 1-P(Type II error) = 1-b • Example: • H0: m1- m2 = 0 HA: m1- m2 > 0 • s12= s22 = 25 n1 = n2 = 25 • Decision Rule: Reject H0 (at a=0.05 significance level) if: