Download
1 / 13
130 likes | 419 Vues
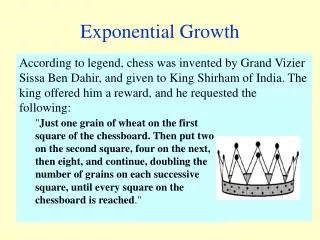
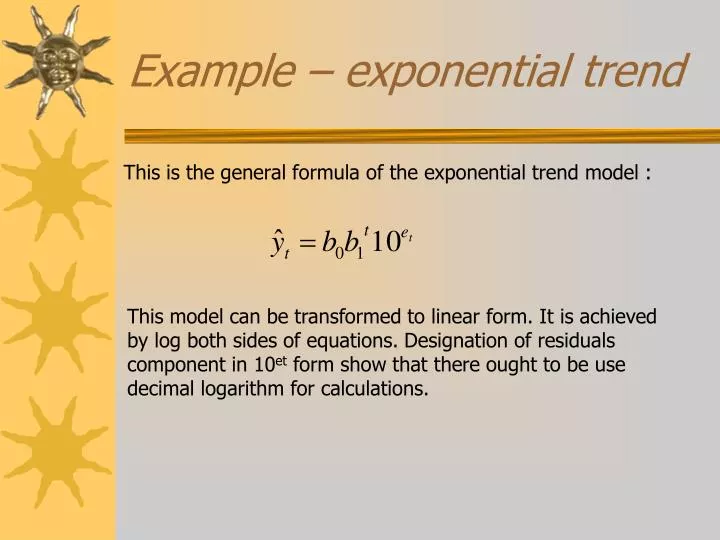
Example – exponential trend. This is the general formula of the exponen t ial trend model :.

E N D
Example – exponential trend This is the general formula of the exponential trend model : This model can be transformed to linear form. It is achieved by log both sides of equations. Designation of residuals component in 10etform show that there ought to be use decimal logarithm for calculations.
Example – exponential trend This is the formula of model modified to linear form: In object to calculate structural parameters of model has been used the OLS method. We will need logarithms of Y to our calculation. We will get the vector of structural parameters of model by using to our calculation matrix algorithm.
Example – exponential trend The vector of coefficients : Finally, the transformed linear form of model is: If we want to go back to non-linear form we should calculate antilog for both sides of equation.
Example – exponential trend The estimated trend model in exponential form: Estimator b0 - theoretical Y value in period preceding the analysis (t=0). Estimator b1 – means that in comparing every following analysing period with previous period, weekly sales has increased 1,052 times(or 5,2%)
Forecasts – exponential trend Forecast for T=27 First method: Second method: In time period T=27 the weekly sales will be equal 71011 units
Confidence interval for forecast where: lower limit upper limit confidence level
Confidence interval for forecast where: log forecast for time period T
Confidence interval for forecast where: t-Student at the level of significance alpha and n-k degrees of freedom (n-number of cases, k-number of estimators; for linear models k=2)
Confidence interval for forecast where: Mean Forecast Error
Confidence interval for forecast where: Expected log forecast
Confidence interval - interpretation • We would conclude with 95% confidence that the forecasted sales for T=27 will be between 53603 and 94073 units. • It means that we are 95% sure that the weekly sales will be from 53603 to 94073 units.