Download
1 / 28
290 likes | 534 Vues
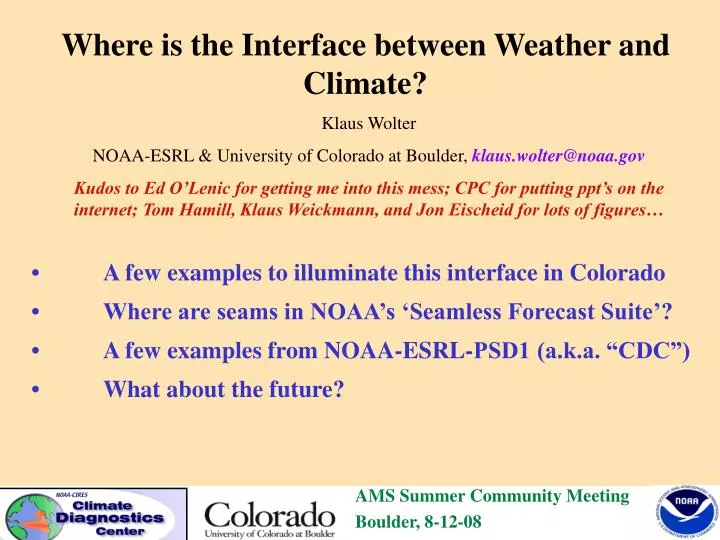
Where is the Interface between Weather and Climate?. Klaus Wolter NOAA-ESRL & University of Colorado at Boulder, klaus.wolter@noaa.gov Kudos to Ed O’Lenic for getting me into this mess; CPC for putting ppt’s on the internet; Tom Hamill, Klaus Weickmann, and Jon Eischeid for lots of figures….

E N D
Where is the Interface between Weather and Climate? Klaus Wolter NOAA-ESRL & University of Colorado at Boulder, klaus.wolter@noaa.gov Kudos to Ed O’Lenic for getting me into this mess; CPC for putting ppt’s on the internet; Tom Hamill, Klaus Weickmann, and Jon Eischeid for lots of figures… • A few examples to illuminate this interface in Colorado • Where are seams in NOAA’s ‘Seamless Forecast Suite’? • A few examples from NOAA-ESRL-PSD1 (a.k.a. “CDC”) • What about the future? AMS Summer Community Meeting Boulder, 8-12-08
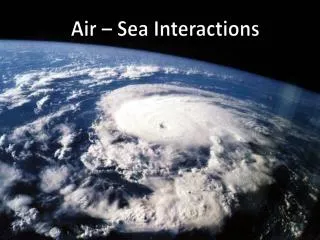
A few (personal?) definitions of weather vs. climate: • Climate = Integral over weather events; • Climate is more than 1st moment statistics (means); • Interface of weather and climate is where we don’t care anymore about deterministic forecasts of conditions at a point in time, but rather the probability distribution of conditions around that point in time. • This interface is fuzzy - predictability is seasonally, regionally, and weather-regime dependent, and will hopefully improve in the future.
What are the climatological probabilities for precipitation around here? Western Regional Climate Center, http://www.wrcc.dri.edu/summary/Climsmco.html
What are the climatological probabilities for precipitation around here? This is when the local WSFO should not talk about increased rainfall chances if predicting 30% odds! Western Regional Climate Center, http://www.wrcc.dri.edu/summary/Climsmco.html
How important are different seasons around here? Winter contributes most at highest elevations, while summer is most important in eastern Colorado. Lack of precip during peak season often leads to onset of drought conditions. Based on PRISM data http://www.prism.oregonstate.edu/
How important is ENSO around here? Winter tends to be wet (dry) in the highest (lowest) elevations with La Niña (El Niño). Summer tends to be wet (dry) with El Niño (La Niña) over eastern CO. Based on PRISM data http://www.prism.oregonstate.edu/
ENSO impacts (subseasonal) In the Front Range, damaging wind storms tend to be less frequent with El Niño than under ENSO-Neutral or La Niña conditions. However, there are longer-term fluctuations that enhance/suppress the odds for wind storms around here (60s & early 70s had more frequent & severe cases than recent years). Since wind storms are one mechanism to evacuate pollutants (to Kansas), El Niño may have more/ longer-lasting winter air pollution episodes. El Niño winters tend to have fewer arctic air outbreaks along the spine of the Rockies than Neutral or La Niña winters, while the lack of wind storms also reduces the risk of ‘full-blown’ (warm) Chinook conditions. Therefore, the intraseasonal temperature range tends to be suppressed with El Niño (few sub-zero lows, as well as few highs in the 70sF - yes, that is a suppressed range), while La Niña and Neutral winters tend to have a wider temperature range.
ENSO vs. Colorado weather: Denver Snow Storms Spring and fall snow storms are more likely with El Niño, but moderate mid-winter snows are more frequent with La Niña. Heavy snow storms (>12”/day) are not common in Denver, but much more likely with El Niño than with La Niña. Since 1996-7, Denver has seen four such storms in October ‘97, March ‘98, March ‘03, and December ‘06 (all during El Niño seasons).
Front Range City Snowstorms Top 10 Snowstorms in Fort Collins, Boulder, and Denver (since 1950) Units are in 1/10”; bold = 2ft.+; underlined dates refer to storms at two+ stations. FCL BOU DEN 1. 320(17-19mr03) 299(24-26oc97) 318(17-19mr03) 2. 278(5-7my78) 260(20-21de06) 238(24-25de82) 3. 221(20-22no79) 259(29-31mr70) 219(24-25oc97) 4. 214(29-31mr70) 241(8-10ap59) 215(26-27no83) 5. 214(3-5ap83) 240(20-21no79) 207(21de06) 6. 208(2-3ap57) 230(5-6my78) 187(5-6mr83) 7. 199(21-22de06) 229(2-3ap57) 177(19-21no79) 8. 195(30mr-1ap88) 225(18-19mr03) 173(2ap57) 9. 187(1-3ja71) 215(23-25no92) 169(20-21mr52) 10. 187(2-4no73) 210(17-19se71) 162(16-18no91) #spring storms: 6 (latest: May) Spring: 5 (latest: May) Spring: 4 (latest: April) There are four big storms shared across all three stations: in April ‘57, November ‘79, March ‘03, and December ‘06. Before 1950, the early December 1913 and early November 1946 storms are the two biggest snow storms on record.
Front Range City Snowstorms and ENSO Top 10 Snowstorms in Fort Collins, Boulder, and Denver (since 1950) Units are 1/10”; MEI >0.5/<-.5 for El Niño/La Niña conditions (+/- for smaller ∆). FCL BOU DEN 1. 320(17-19mr03) 299(24-26oc97) 318(17-19mr03) 2. 278(5-7my78-) 260(20-21de06) 238(24-25de82) 3. 221(20-22no79) 259(29-31mr70+) 219(24-25oc97) 4. 214(29-31mr70+) 241(8-10ap59+) 215(26-27no83-) 5. 214(3-5ap83) 240(20-21no79) 207(21de06) 6. 208(2-3ap57+) 230(5-6my78-) 187(5-6mr83) 7. 199(21-22de06) 229(2-3ap57+) 177(19-21no79) 8. 195(30mr-1ap88) 225(18-19mr03) 173(2ap57+) 9. 187(1-3ja71) 215(23-25no92) 169(20-21mr52+) 10. 187(2-4no73) 210(17-19se71) 162(16-18no91) Count: 5E, 2 L5 E, 1 L7 E, 0 L Only one season features more than one “Top 10” storm: 1982-83 (3*)! (Both Dec ‘13 and Nov ‘46 storms happened during modest El Niño conditions)
The “NOAA Seamless Suite of ForecastProducts Spanning Climate and Weather” (CPC, 2007) Outlook Guidance Threats Assessments Forecast Lead Time Forecasts Watches Warnings & Alert Coordination Benefits Service Center Perspective Forecast Uncertainty Years Seasons Months Week 2 Hazards Assessment CPC 2 Week Climate/Weather Linkage 6-10 Day Forecast 1 Week NDFD, Days 4 -7 HPC OPC TPC Days • Winter Weather Desk Days 1-3 • Tropical Storms to Day 5 • Severe Weather to Day 3 SPC AWC SWPC Hours Minutes Health Maritime Aviation Agriculture Recreation Commerce Ecosystem Hydropower Environment Fire Weather Emergency Mgmt Life & Property Energy Planning Space Operations Reservoir Control The NCEP Centers span Seamless Suite
The “NOAA Seamless Suite of ForecastProducts Spanning Climate and Weather” (CPC, 2007) Outlook Guidance Threats Assessments Forecast Lead Time Forecasts Watches Warnings & Alert Coordination Benefits NCEP Model Perspective Forecast Uncertainty Years Seasons Months Climate Forecast System 2 Week North American Ensemble Forecast System Climate/Weather Linkage 1 Week Global Forecast System Short-Range Ensemble Forecast Days Ocean Model Hurricane Models North American Forecast Hours Rapid Update Cycle for Aviation • GFDL • WRF Dispersion Models for DHS Minutes Health Maritime Aviation Agriculture Recreation Commerce Ecosystem Hydropower Environment Fire Weather NCEPs model production suite provides guidance for climate prediction Emergency Mgmt Life & Property Energy Planning Space Operations Reservoir Control
A few comments on the “NOAA Seamless Suite of ForecastProducts Spanning Climate and Weather” • How well do we really know the current and future forecast uncertainty? Is uncertainty at weather-climate interface biggest?
A few comments on the “NOAA Seamless Suite of ForecastProducts Spanning Climate and Weather” • How well do we really know the current and future forecast uncertainty? Is uncertainty at weather-climate interface biggest? • How well do the different forecast centers (alphabet soup below CPC) interact with each other and with CPC? Should CPC have more competition?
A few comments on the “NOAA Seamless Suite of ForecastProducts Spanning Climate and Weather” • How well do we really know the current and future forecast uncertainty? Is uncertainty at weather-climate interface biggest? • How well do the different forecast centers (alphabet soup below CPC) interact with each other and with CPC? Should CPC have more competition? • What about ENSO composites,’OCN’, ‘CCA’, all of those statistical workhorses that have gotten us this far?! What about some newer tools like Reforecasts, Linear Inverse Models, statistical forecasts of the MJO? What about the collective human expertise (CPC+)?
A few comments on the “NOAA Seamless Suite of ForecastProducts Spanning Climate and Weather” • How well do we really know the current and future forecast uncertainty? Is uncertainty at weather-climate interface biggest? • How well do the different forecast centers (alphabet soup below CPC) interact with each other and with CPC? Should CPC have more competition? • What about ENSO composites,’OCN’, ‘CCA’, all of those statistical workhorses that have gotten us this far?! What about some newer tools like Reforecasts, Linear Inverse Models, statistical forecasts of the MJO? What about the collective human expertise (CPC+)? • Don’t throw out the baby with the bathwater - even ten years fron now, CFS should not be the only tool around, since so much more ‘bang for the buck’ can be extracted with statistical methods!
What is a reforecast? A hindcast, a numerical prediction for a date in the past using the model and data assimilation system that is currently operational. Hamill, pers.comm., 2008
Why compute reforecasts? For many forecast problems, such as long-lead forecasts or high-precipitation events, a few past forecasts may be insufficient for calibrating the probabilistic forecasts. Hamill, pers.comm., 2008
Comparison against NCEP / CPC forecasts at 155 stations, 100 days in winter 2001-2002 temperature forecasts Reforecast calibrated Week-2 forecasts more skillful than operational NCEP/CPC 6-10 day, which was based on human blending of NCEP, ECMWF, other tools. precipitation forecasts Hamill, pers.comm., 2008
More recent findings Reforecasts shown to aid in calibration of forecasts for a wide variety of applications Still a large benefit from forecast calibration, even with state-of-the-art ECMWF forecast model. Temperature calibration: Short leads: a few previous forecasts adequate for calibration Long leads: better skill with long reforecast training data set. Precipitation calibration Low thresholds: a few previous forecasts somewhat ok for calibration Larger thresholds: large benefit from large training data set. Skill when trained with daily data not much larger than when trained with weekly data (preliminary result, more testing needed). Hagedorn, R., T. M. Hamill, and J. S. Whitaker, 2008: Probabilistic Forecast Calibration Using ECMWF and GFS Ensemble Forecasts. Part I: Surface Temperature. Mon. Wea. Rev., 136, 2608-2619. Hamill, T. M., J. S. Whitaker, and R. Hagedorn, 2008: Probabilistic Forecast Calibration Using ECMWF and GFS Ensemble Forecasts. Part II: Precipitation. Mon. Wea. Rev., 136, 2620-2632.
‘Milking’ the MJO/ Angular momentum cycles 6 7 dMR/dt > 0 MR > 0 western Pacific convection transition to twin subtropical cyclones w Pac anticyclones meridional RWD PNA+ 5 8 weak MJO west hemisphere/ Africa convection Maritime continent convection transition to twin subtropical anticyclones W Pac cyclones 1 4 meridional RWD PNA- Indian Ocean convection MR < 0 2 3 dMR/dt < 0 Weickmann&Barry, pers.comm., 2008
RWD from WPAC tropical convection forces western USA trough H L L H H H L storms H MJO phase 8 plus La-Nina!!! Weickmann&Barry, pers.comm., 2008
GFS ENS mean predicts a ridge ACC ~0! Ed Barry’s blog hinted at the trough scenario on March 15th! See:http://weatherclimatelink.blogspot.com/ Weickmann&Barry, pers.comm., 2008
Downscaling will be important for monitoring and prediction products GIS: Geographical Information System A popular format that allows meteorological fields to be superposed over topography, rivers, roads, and cities. GIS format is preferred by many users. CPC is working with NCO to convert its monitoring and outlook products (CPC, 2007)
NCEP and CPO Climate Support: Climate Test Bed (CPC, 2007) Climate Community Climate Test Bed Research & Development NOAA Climate Forecast Operations Mission:To accelerate the transition of scientific advances from the climate research community to improved NOAA climate forecast products and services.
NCEP and CPO Climate Support: Climate Test Bed (CPC, 2007) • The CTB is a resource to accelerate scientific advances to operations • Bridging the “Valley of Death” between research & operational service applications • Embracing the R2O and O2R paradigms • The CTB emphasizes high profile science activities • CFS/GFS Improvements (CFSRR) • Multi-model ensembles (IMME, NMME) • Objective climate forecast products and applications (drought / NIDIS) • Competitive Grants Program - How is the funding situation??? • CTB-COLA Seminar Series • CPC-RISA Program • Distinguished Visiting Scientist Program (FY09)
What is around the corner? • Yes, it will be warmer 50-100 years from now. Meanwhile, what will happen in the next decade or two? • What is the likelihood of shifts in PDO and AMO towards a colder climate? Not unrelated, what if we get more prolonged La Niña events? • If we get more intense precipitation events, could this translate into a better chance for heavy snow storms which might result in more intense, shallow cold waves? The late December 2006 blizzard was followed by the coldest winter on record in southeastern Colorado, despite above-normal temperatures above the boundary layer! • If we continue to see earlier snow melt seasons, does this translate into earlier monsoon seasons as well since the surface heat low can set up earlier? Or will the longer snow-free season result in a longer wildfire season which could suppress the monsoon thru aerosols, mid-tropospheric inversions, and lower incoming radiation? IMHO, that is what happened in 2002.
What is around the corner? • What about the weather-climate interface? • What is the MJO going to look like with a warmer tropical ocean to support convection? Does this make the 1-4 week forecast problem easier or harder? • Now that we have barely figured out what the ENSO teleconnections are, how stable will they be, given that the planet is warming up? • Are we going to solve how to incorporate snow-albedo- as well as soil moisture - temperature feedbacks to make better 1-4 week forecasts? • With people moving (back) into urban areas, are we going to take into account the urban heat island effect in our forecasts, and does it intensify over time during heat waves?