Download
1 / 20
200 likes | 207 Vues
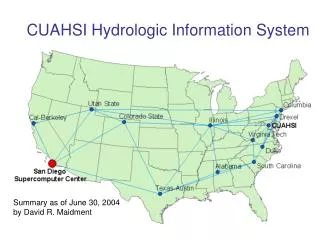
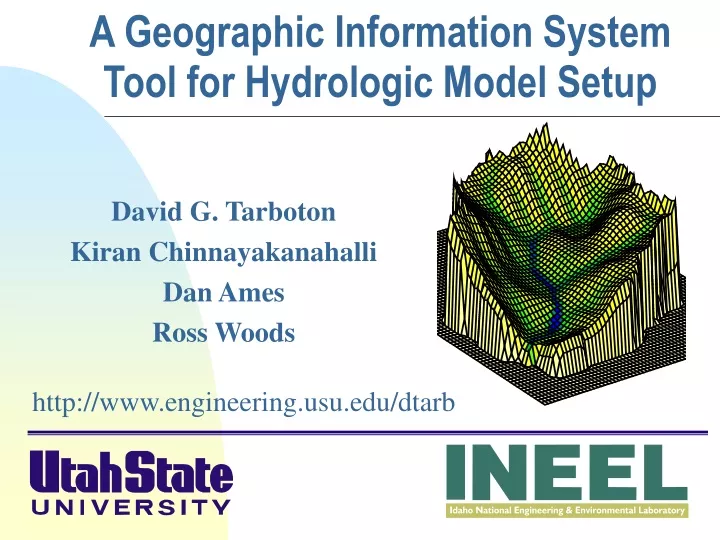
A Geographic Information System Tool for Hydrologic Model Setup. David G. Tarboton Kiran Chinnayakanahalli Dan Ames Ross Woods. http://www.engineering.usu.edu/dtarb. Distributed Hydrologic Modeling. Objective DEM based delineation of watersheds and channel networks

E N D
A Geographic Information System Tool for Hydrologic Model Setup David G. Tarboton Kiran Chinnayakanahalli Dan Ames Ross Woods http://www.engineering.usu.edu/dtarb
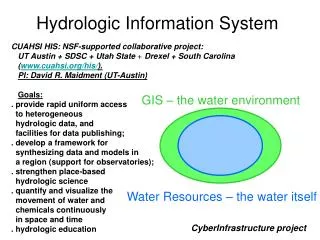
Distributed Hydrologic Modeling • Objective DEM based delineation of watersheds and channel networks • Creation of watershed and channel reach routing network • Computation of topographic model input parameters (drainage area, channel length, width and slope, wetness index distribution) • Computation of watershed parameters based on soil and vegetation classes by zonal averages
Hydrologic processes are different on hillslopes and in channels. It is important to recognize this and delineate model elements that account for this.
Concentrated and dispersed contributing area and specific catchment area
How to decide on drainage area threshold to determine channels and watershed model elements? 500 cell theshold 1000 cell theshold
Same scale, 20 m contour interval Driftwood, PA Sunland, CA Topographic Texture and Drainage Density
Nodes Links Single Stream Strahler Stream OrderStream Drop: Elevation difference between ends of stream • most upstream is order 1 • when two streams of a order i join, a stream of order i+1 is created • when a stream of order i joins a stream of order i+1, stream order is unaltered Note that a “Strahler stream” comprises a sequence of links (reaches or segments) of the same order
Look for statistically significant break in constant stream drop property Break in slope versus contributing area relationship Physical basis in the form instability theory of Smith and Bretherton (1972), see Tarboton et al. 1992 Suggestion: Map channel networks from the DEM at the finest resolution consistent with observed channel network geomorphology ‘laws’.
Statistical Analysis of Stream Drops Threshold = 20 Dd = 1.9 t = -1.03 Threshold = 10 Dd = 2.5 t = -3.5 Threshold = 15 Dd = 2.1 t = -2.08 Stream drop test for Mawheraiti River. For each upward curved support area threshold the stream drop for each stream is plotted against Strahler stream order. The large circles indicate mean stream drop for each order The weighted support area threshold, drainage density (in km-1) and t statistic for the difference in means between lowest order and all higher order streams is given.
Curvature based stream and watershed delineation with automatic threshold by constant drop analysis
Stream line Contour line Upslope contributing area a Hydrologic Model • TOPMODEL (Beven and Kirkby, 1979 and later) applied to each subwatershed. • Temperature and radiation based potential (reference) evapotranspiration. • Vegetation based interception component. • Modified soil zone • Adjust ET based on soil moisture availability in root zone • Infiltration excess runoff generation capabiity • unsaturated storage and drainage • Parameters scaled by GIS average properties over each subwatershed. • Kinematic wave routing of streamflow through channel network.
Spatially constant Parameters Spatially variable Hydraulic conductivity K, calibrated using multiplying factor applied to spatially variable values. The soil capacity parameter ‘soilc’ is estimated as (soil zone depth)/(dth1+dth2)
Basin average precipitation Streamflow at outlet Cumulativewater balance
TauDEM Software Functionality • Pit removal (standard flooding approach) • Flow directions and slope • D8 (standard) • D (Tarboton, 1997, WRR 33(2):309) • Flat routing (Garbrecht and Martz, 1997, JOH 193:204) • Drainage area (D8 and D) • Network and watershed delineation • Support area threshold/channel maintenance coefficient (Standard) • Combined area-slope threshold (Montgomery and Dietrich, 1992, Science, 255:826) • Local curvature based (using Peuker and Douglas, 1975, Comput. Graphics Image Proc. 4:375) • Threshold/drainage density selection by stream drop analysis (Tarboton et al., 1991, Hyd. Proc. 5(1):81) • Wetness index and distance to streams • TopNet model specification file generation
TauDEM Software Architecture ESRI ArcGIS 8.1 (under development ) VB GUI application Standalone command line applications C++ COM DLL interface Available from TauDEM C++ library Fortran (legacy) components http://www.engineering.usu.edu/dtarb/ USU TMDLtoolkit modules (grid, shape, image, dbf, map, mapwin) ESRI gridio API (Spatial analyst) Vector shape files ASCII text grid Binary direct access grid ESRI binary grid Data formats
Conclusions • Terrain analysis using digital elevation models provides considerable capability useful in hydrologic analysis. • Constant stream drop law used to objectively and automatically determine drainage area threshold and drainage density consistent with the natural texture of the topography. • Facilitated the representation of distributed information about hydrologic condition on a watershed • Used in spatially distributed and networked implementation of TOPMODEL for modeling of spatially distributed hydrology based upon topography and GIS data (vegetation and soils).