Download
1 / 37
370 likes | 456 Vues
Hydrologic Information System for North Texas. John A. McEnery, University of Texas at Arlington Paul W. McKee, National Weather Service Gregory P. Shelton, National Weather Service LCRA: October 8, 2010. CUAHSI.

E N D
Hydrologic Information System forNorth Texas John A. McEnery, University of Texas at Arlington Paul W. McKee, National Weather Service Gregory P. Shelton, National Weather Service LCRA: October 8, 2010
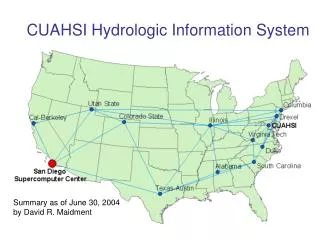
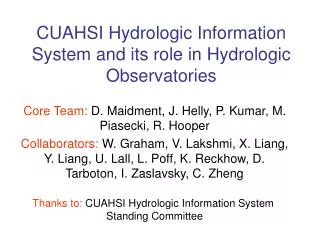
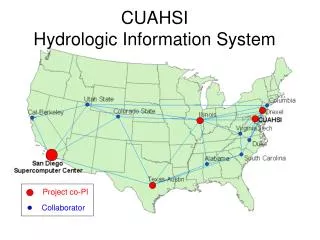
CUAHSI • A consortium of 145 research universities, 7 affiliate members, and 16 international affiliates • The University of Texas at Arlington is a member of the Consortium of Universities for the Advancement of Hydrologic Science (CUAHSI).
CUAHSI UCAR Unidata • NSF supports CUAHSI to develop infrastructure and services to advance hydrologic science in US universities Atmospheric Sciences Earth Sciences Ocean Sciences CUAHSI National Science Foundation Geosciences Directorate HIS
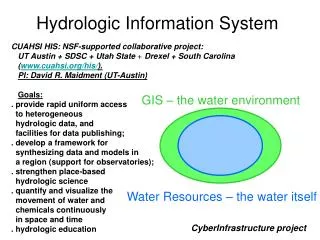
CUAHSI HIS • The CUAHSI Hydrologic Information System (HIS) is an internet based system for sharing hydrologic data. • Comprised of hydro-databases and servers connected through web services as well as software for data publication, discovery and access.
Precipitation Soil Moisture Water Quantity (Surface Flow) Reservoir Gains/Releases Meteorology Groundwater Flux Flood Hazard: Key Hydrologic Data
WORKFLOW DIAGRAM OF HIS SYSTEM Data Discovery and Integration platform HIS Central Like search portals Google, Yahoo, Bing Metadata Search Metadata Services Service and data theme metadata Service registration Data carts Catalog harvesting Data Services HydroServer HydroDesktop Data Synthesis and Research platform Data Publication platform Water Data Services Spatial Data Services UTA / NWS FOCUS Like HTML Like web servers Like browsers
Publication of Point Observations • Observations Data Model (ODM) • Stores Hydrologic Observations along with Ancillary Information (Metadata) about the Observations • Designed to Optimize Data Retrieval • Standardized Format for Sharing Information • ODM Controlled Vocabularies • Ontology Includes • Biota • Chemical / Geo • Hydrologic
Publication of Point Observations • WaterOneFlowweb services • Data are transmitted in WaterML format • Generic across different data providers
WaterOneFlow Service Descriptions • GetSiteInfoGiven a site number, this method returns the site's metadata. • GetSiteInfoMultpleObjectGiven a site number, this method returns the site's metadata. • GetSiteInfoObjectGiven a site number, this method returns the site's metadata. • GetSitesGiven an array of site numbers, this method returns the site metadata for each one. • GetSitesByBoxObjectGiven a site number, this method returns the site's metadata. • GetSitesObjectGiven an array of site numbers, this method returns the site metadata for each one. • GetValuesGiven a site number, a variable, a start date, and an end date, this method returns a time series. • GetValuesForASiteObjectGiven a site number, this method returns the site's metadata. • GetValuesObjectGiven a site number, a variable, a start date, and an end date, this method returns a time series. • GetVariableInfoGiven a variable code, this method returns the variable's name. • GetVariableInfoObjectGiven a variable code, this method returns the variable's siteName. • GetVariablesGiven a variable code, this method returns the variable's name. • GetVariablesObjectGiven a variable code, this method returns the variable's siteName.
COMET Pilot Project • Collaboration of… • University of Texas at Arlington • National Weather Service - West Gulf River Forecast Center (NWS – Fort Worth, TX) • Funded through… • University Corporation for Atmospheric Research (UCAR) COMET Partners Program with support from the National Science Foundation
Pilot Project Background • Project Objective • Develop server system for distribution of rainfall information from the National Weather Service – West Gulf River Forecast Center (WGRFC). • Target dataset – • Daily precipitation (MPE values) for the Dallas and Fort Worth metroplex.
Objective Expanded • Increase data coverage • Daily and Hourly MPE values • Entire WGRFC Service Area • Current and Archived Values • Hourly extending to 1997 • Daily extending to 1995
MPE • Multi-sensor Precipitation Estimate • Forecasters use gauge and radar estimated precipitation to produce a “best estimate” hourly product • QA/QC product generated at the RFC
MPE • Based upon the Nexrad WSR-88D hourly digital preciptiation array. • Multi-level processing sequences which also incorporates satellite, rain gauge and even CoCoRaHS information. Seo, D.-J., et.al., 2010. Radar and multisensor rainfall estimation for hydrologic applications. in “Physical Rainfall”, M. Gebremichael and F. Testik, Editors., AGU
Precipitation Best Estimate Gauge Radar Satellite Best Estimate (Multi-sensor Field) “Best Estimate” of past precipitation Gridded hourly estimates Human quality control of data inputs
West Gulf River Forecast Center (WGRFC) Radar Coverage Map
WSR-88D DHR DPA Hydro-Estimator Rain Gauges Multi-Sensor Precipitation Estimator (MPE) Lightning NWP model output RFC
HRAP Universal Grid System • NWS Hydrologic Rainfall Analysis Project (HRAP) grid coordinate system. • Developed to make it feasible to mosaic coverage between several radars. • It is a projection like other projections used in GIS, but assumes a spheroid rather than an ellipsoid. • Approximately 4 km x 4 km grid with centers located by latitude, longitude and also HRAP x- and HRAP y-coordinates. • MPE values are cataloged in XMRG files based upon the HRAP grid system
UTA HIS Architecture NWS WGRFC / SRH CUAHSI Central XMRG Content WaterML WaterShed WaterDrop Java Script Microsoft Server 2008 MS SQL Server 2008 CUAHSI ODM WaterOneFlow Services (2.83Ghz IC7 – 20 Gb SDRAM) Linux Red Hat 5.0 LDM 6.8 Data Manager Reservoir QNAP NAS 16Tb External Storage
Project Status • Archived Daily MPE (1995- Sept. 2010) available • Archived Hourly MPE (1997- Sept. 2010) being registered. • Update stream via Unidata Local Data Manager (LDM) • Routed through NWS Southern Region Headquarters. • LDM connection being configured.
Project Status • SQL Scalability Considerations • Archived Hourly MPE (1997- Sept. 2010) • Registration may be handled in sections
Tropical Storm Hermine Hourly Time Series Arlington, TX
Tropical Storm Hermine Hourly Time Series –– Arlington, TX
Broader Impacts • Integrated Water Resources Science & Services (IWRSS) • Provide the Nation with a seamless suite of consistent water resources monitoring and forecast information – summit to sea. • Federation of Central Servers
Broader Impacts • U.S. Army Corps of Engineers • "Building Strong Collaborative Relationships for a Sustainable Water Resources Future" • Building the "Federal Tool Box" • A data and products warehouse for all federal water resources information. • IWRSS is seen as a component of this larger USACE initiative • National Report: Responding to National Water Resources Challenges, August, 2010
NATIONAL REPORT: STATES’ TOP NEEDS Create an information hub for access to more comprehensive and accurate data and information, including GIS-based and risk-informed maps, in support of water resources management. Share data and information more widely and readily. Use comprehensive, holistic and systems-oriented planning processes for integrated water resources management within a sustainability paradigm. Attend to water infrastructure by ensuring its operation and maintenance, rehabilitation, removal or replacement with new infrastructure. Promote greater collaboration, coordination and communication among water resources stakeholders to derive agreed-upon plans and management decisions. Seek to balance competing water uses and to avoid or resolve conflicts over water use. Seek technical planning assistance and expertise to improve water resources assessments, planning and management within a holistic systems perspective that aims to balance objectives. Improve regulatory processes to streamline permitting and reduce regulatory burdens. Practice and reinforce adaptive management in collecting and analyzing water resources information to understand what is working or not working and why, and to improve performance. Improve water quality in rivers, streams, tributaries, lakes, reservoirs, oceans and other water bodies. Explore developing a unifying national water direction with guiding principles.
Broader Impacts • North Texas Hydrologic Information System. • Corps of Engineers, • NCTCOG • Municipal Governments • Collaboration with TNRIS / TWDB. • UTA HIS gateway to deliver MPE to TNRIS
Broader Impacts • Collaboration with Tarrant Regional Water District. • Developing Hydrologic Information System for Tarrant Regional Water District. • To support operation of the Fort Worth Floodway Rainfall-Runoff Model (FWFRRM). • Partners include TRWD, NWS, USGS & USACE.
Broader Impacts Arlington Regional Data Center (ARDC). Originally a component of UTA prior to being elevated by the UT-System as regional center. Tier III facility available to provide fail proof capabilities for mission critical operations. State-of-the-art data and high performance computing center. 24/7 sysop / uninterruptable power / security.