Download
1 / 14
140 likes | 262 Vues
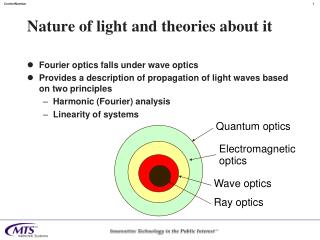
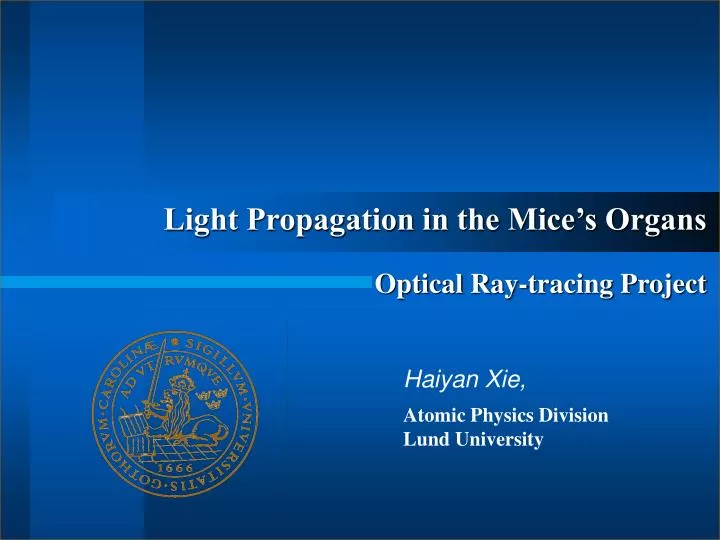
Light Propagation in the Mice’s Organs Optical Ray-tracing Project. Haiyan Xie, Atomic Physics Division Lund University. Outline. Introduction Aim of this project Photodynamic therapy (PDT) Variations of optical parameters, i.e., μ a , μ s , and g, in PDT Experiments and Simulations

E N D
Light Propagation in the Mice’s OrgansOptical Ray-tracing Project Haiyan Xie, Atomic Physics Division Lund University
Outline • Introduction • Aim of this project • Photodynamic therapy (PDT) • Variations of optical parameters, i.e., μa, μs, and g, in PDT • Experiments and Simulations • Ex vivo absorption spectroscopy • FRED simulations • Results • Discussions
Aim of this project • How PDT works? • a) A patient comes to the clinic with a tumour. The photosensitiser is given by injection. • b) After time the photosensitiser concentrates in the tumor. • c) The photosensitiser is activated by light. • d) The tumor is selectively destroyed. • (Adapted from http://www.bmb.leeds.ac.uk/pdt/PDToverview.htm) To simulate the light distribution in the animal organs after the photodynamic therapy (PDT).
Experiments • A xenon short-arc lamp (white light) • Source and detection optical fibers 2 mm fiber seperation The path length of the collected photons is relatively insensitive to the tissue scattering variations. Probe Tumor / Organ • Experiments to achive the concentrations of the sensitizer • in the tumor or other organs in a mouse Absorption Spectroscopy
Experiments Left) Ex vivo absorption spectroscopy measurements, OPS-1000 Biospectrometer TM (Optimum Technologies, Inc), and Right) Sample tissues.
FRED Simulations System geometry in the FRED simulation. • collimated light source: 1 W • source and detection fibers: 400 mm- and 200 mm- diam • size of the tissue: 4 mm diameter * 4 mm height • # of rays: 250,000
Optical Parameters of the Tissue • 2 mm fiber seperation: • Scattering coefficient, ms= 1 mm-1 • Anisotropy coefficient, g=0.9 • Absorption coefficient, ma : • Varies due to the interactions between the photosensitiser and the tissue: The concentrations of different chromophores have been changed. • Photosensitizer (mTHPC), • Oxyhemoglobin (HbO) • Deoxyhemoglobin (Hb)
where ’s concentration changes ’s the corresponding extinction coefficients, dependent on the wavelength Extinction coefficients of mTHPC, Hb and HbO. Absorption coefficient • The changes of the tissue absorption coefficients :
Absorption of water. Absorption coefficient • It is assumed that the absorption in the tissue is mainly caused by the water with the concentration of 60% initially.
= 0.485mM = 2.532mM = 4.797mM = 188.933mM = 9.835mM = 114.574mM Absorption coefficient • Mouse #: DL82 (8 hours after the drug injection) Absorption coefficients of the mouse tissues
Simulation Results (1) Tumor: Simulation: Measured:
Simulation Results (2) Liver: Simulation: Measured:
Discussions • More rays: a much longer simulation time A disadvantage of the FRED software when dealing with a scattering process? • Very small output power


![G3 - RADIO WAVE PROPAGATION [3 Exam Questions - 3 Groups]](https://cdn0.slideserve.com/484375/g3-radio-wave-propagation-3-exam-questions-3-groups-dt.jpg)

![G3 - RADIO WAVE PROPAGATION [3 Exam Questions - 3 Groups]](https://cdn1.slideserve.com/3333950/g3-radio-wave-propagation-3-exam-questions-3-groups-dt.jpg)