Download
1 / 23
230 likes | 351 Vues
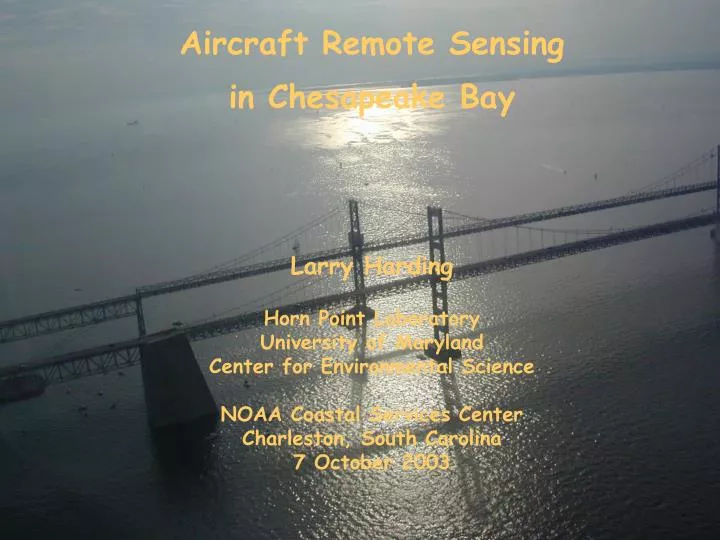
Aircraft Remote Sensing in Chesapeake Bay Larry Harding Horn Point Laboratory University of Maryland Center for Environmental Science NOAA Coastal Services Center Charleston, South Carolina 7 October 2003. http://www.cbrsp.org. History of Program.

E N D
Aircraft Remote Sensing in Chesapeake Bay Larry Harding Horn Point Laboratory University of Maryland Center for Environmental Science NOAA Coastal Services Center Charleston, South Carolina 7 October 2003
History of Program • Started in 1988 with NASA Ocean Data Acquisition System (ODAS) on • test flights in collaboration with NASA, NOAA and CBP; • Spring-summer flight series began in 1989; spring-fall flight series • began in 1990 and now extends through 2003; • Initial goal was to better define spatial and temporal extent of the • winter-spring diatom bloom and of summer dinoflagellate blooms; • Developed regional algorithms using a combination of aircraft and • shipboard data to recover surface chlorophyll (chl-a), temperature • (SST) and integrated, water-column chlorophyll as a measure of • phytoplankton biomass; • Introduced SAS II in 1995 and SAS III in 1997, replacing ODAS with • more capable instruments; • Web page (http://www.cbrsp.org) launched in spring 2001 containing • complete imagery from ODAS, SAS II and SAS III flights on the main • stem Bay for 1989-2003, and from Choptank and Patuxent river flights, • 1999-2001.
Effect of freshwater flow from the Susquehanna R. on the magnitude and position of the spring diatom bloom
Freshwater flow from the Susquehanna R. during LMER TIES (1995-2000); cumulative flow volumes show 1996 had significantly higher flow than other years in the recent record Year
Aircraft Main stem Bay Piper Aztec Tributaries Cessna Skyhawk
Instrumentation • SeaWiFS Aircraft Simulator (SAS III) (Satlantic, Inc.) for measurements of ocean color to determine chlorophyll con-centrations; • Infrared Thermometer (Heimann Instruments, Inc.) to measure sea surface temperature.
Chesapeake Bay main stem flight tracks
Comparison of shipboard, satellite and aircraft recoveries of chl-a for matching dates in 1998
CBPM-1 and CBPM-2 recoveries of gross PP for LMER TIES data, 1995-98. CBPM models are multiple regression DIMs in logarithmic space, using the “usual” suspect variables of this lineage of models
Comparison of PP from LMER TIES cruises in 1999 with PP from CBPM-2 applied to merged aircraft/ shipboard data for the lower Bay
So, where do we go next? • Develop models of AIP based on TN/TP loading using AIP data from • CBPM-2 applied to merged aircraft/shipboard data; • Satellite chl-a retrievals from SeaWiFS ocean color measurements • offer the advantage of synopticity and are increasingly accurate • for Case II waters exemplified by Chesapeake Bay; • Use these products as inputs to CBPM-2 in the same way we have • with ODAS, SAS II and SAS III products; • Generate time-series of chl-a and PP from spatially-explicit model • outputs to improve the data underlying computations of AIP; • Build on early success with the use of winter-spring TN and TP • loading to predict AIP with aircraft- and satellite-derived products • that have much improved spatial and temporal resolution.
Summary • Phytoplankton biomass and primary productivity (PP) • in Chesapeake Bay are highly variable, both spatially • and temporally; • Variability on seasonal to inter-annual time scales is strongly coupled to winter-spring fresh-water flow; • Ocean color measurements from aircraft provide data that can be used with shipboard observations to estimate PP at high resolution.
Acknowledgments Mike Mallonee, Tom Fisher, Blanche Meeson, Sam White, Wayne Esaias, Eric Itsweire, Elgin Perry, Christy Jordan, Jason Adolf, Dave Miller, Kathleen Cone, Andrea Magnuson, Tom Malone, Mike Lomas, Janet Campbell, Jim Cloern, Ed Houde, Mike Roman, Bill Boicourt, the captains and crews of the R/V Ridgely Warfield, Cape Hatteras, and Cape Henlopen, and pilots of Aerosource and Airborne. Also – NASA, NSF, NOAA, Maryland Sea Grant, and EPA for grant support.