Download
1 / 23
230 likes | 356 Vues
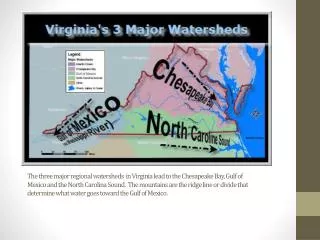
Non Point Source Nutrients in the Chesapeake Bay Watershed. Changes in source types, land uses available for nutrient application, and in data reporting for known sources. Phase 5 Methods/Trends/Effects.

E N D
Non Point Source Nutrients in the Chesapeake Bay Watershed Changes in source types, land uses available for nutrient application, and in data reporting for known sources
Phase 5 Methods/Trends/Effects • What we looked at: Revisited all basic nutrient inputs to the watershed model (including livestock, humans, and fertilizers), land uses and nutrient assimilation capacities. • How we approached the inputs: Obtained new and updated sources of data such as the revised Ag. Census, fertilizer Sales data, soil survey and Ag. Census crop yields. • Emerging Trends/Effects of Approach: Saw changes in nutrient quantities and potential fate, driven by changing sources, management practices, and land use evolution.
Phase 5 Basic Inputs • Populations – revisited human population (U.S. Census), septic system numbers, and livestock (Ag. Census) • Nutrient Content – Examined latest research concerning content of human, and animal waste. • Fertilizer - Analyzed sales database gathered by U. of Kentucky to explore potential for using as an input. • Destination - Expanded manure receiving land-uses, and expanded manure application timing • Uptake - Used soil survey (STATSGO), Ag. Census crop reports, and NRCS Plant Nutrient Content Database to estimate maximum crop yields/uptakes
Population Details • Revised Agricultural Census (2002) – went back to previous years and adjusted according to 1997 changes. • Ag. Census changes resulted in approximately 5-10% increase in poultry and hogs, slight (< 1%) decrease in cattle, spatially distributed • Overall livestock nutrient total decreased slightly as a result of expanded animal classes • Expanded animal classes to better represent growth stage and production rates; included spatial and temporal variation. • Nutrient production variation by weight and gender. • Nutrient weight and gender by geographical region. • Equine surveys in New York, Pennsylvania, Maryland, Delaware, Virginia and West Virginia presented much more detailed view of horses, populations approximately doubled that reported in Ag. Census (doubled the number of horses in the watershed).
Expanded Livestock Classes Phase 5.0 Classes (10) Phase 4.3 Classes (7) Beef Cows & Heifers that have calved Other Cattle Dairy Cows & Heifers that have calved Sows Growers Laying hens >= 20 weeks Pullets and chicks < 20 weeks Broilers Turkeys Horses Beef Dairy Swine Layers Broilers Turkeys Horses
Nutrient Content in Waste • Used revised figures (Metcalf and Eddy, 2003) for human septic system discharge and waste stream content. • Use of mass balance approach (ASAE 2002; Mid West Planning Service, 2003) for predicting nutrient content in livestock waste. • Evaluated state data sets to examine the effects of the dietary supplement phytase in poultry since 2001-2002 • Combines with revised animal classes result in 6% decrease in both nitrogen and phosphorus between phase 4 and 5
Use of fertilizer sales data • University of Kentucky supplies sales data for the entire United States, on a county and state level. • Data becomes more reliable, with consistent county level data after 1994. • Fertilizer correlates fairly well with crop need on a state level, not on a county level. • Calculated a single, basin-wide application rate for phosphorus and nitrogen as a percentage of crop need based on average sales data.
Expanded Nutrient Destination (Land use) • Total of 24 land uses currently • Modeling nutrient management land uses separately • Applying according to recommended application rates or crop removal • Fertilizer application to pasture in areas where it is occurring – Ag Census reports 10% of pasture land receiving commercial fertilizer in PA, MD and VA • Livestock Stream Access Areas Receive higher inputs in proportion to other pasture, due to animal behavior • Varying manure application timing scheme to reflect differences in composite cropland, hay, alfalfa, pasture and seasonality
Nutrient Assimilation • Used soil survey (STATSGO), Ag. Census crop reports, and NRCS Plant Nutrient Content Database to estimate maximum crop yields/uptakes. • Compared STATSGO crop yields to Ag. Census reported yields for 4 years (1987, 1992, 1997, 2002). • STATSGO yields had strong relationship with reported yields (> 99% p-level for mean yield value). • Will use reported crop yield from Ag. Census as a means to evaluate model crop uptake results.
Trends in Nutrient Production • Total Nitrogen production steady over last 10 years, possible decline since 2000, not statistically significant above 75% level. • Phosphorus fairly flat from 1984 to 1994, since then declining slightly
Nutrient quantities: Total Nutrients Produced in Chesapeake Bay Watershed
Sources of nutrient inputs • Overall, Nitrogen fertilizer steady, Phosphorus decreasing. • Percentage of total nitrogen from inorganic fertilizers has remained steady • Percentage of total phosphorus from inorganic fertilizers has decreased. • Percentage of both nitrogen and phosphorus from human wastes has increased. • Evolution from cattle to poultry and back in Phosphorus.
Trends in Fertilizer Sales • Nitrogen Fertilizer increased slightly through mid 90s, possible declining trend since 2000, but not statistically significant ( > 75% level ) • Phosphorus declining - > average 3% per year decrease since 1994, (> 99% confidence level)
Ag. and Human Waste Nitrogen Ag. Nutrients are decreasing, while human nutrients are continuing to increase
Poultry share of ag nutrients • Poultry rose slightly as an overall share of N and P through 1997 • Phytase adoption has led to some decrease in phosphorus since 2001-2002 • Uneven adoption of phytase in different industries minimizes effects in some sectors, but overall, the big hitters (broilers, layers, turkeys) have widespread adoption and significant measured reductions (~19% in data thus far evaluated)
Land Use/Nutrient Assimilation • Agricultural land has decreased. • Urban lands have increased in acreage, have a lower overall assimilative capacity than do agricultural lands • Overall assimilative capacity in total lbs has decreased. • Overall pounds of nutrients per acre of usable land has increased.
Conclusions • Land use trends result in a greater amount of human share of nutrient waste, resulting in a greater emphasis on bio-solids applications. • Benefits of dietary supplements, nutrient management, and public awareness may be seen in terms of phosphorus. • Nitrogen reductions in terms of ag, are balanced by urban fertilizer, human waste nitrogen, and loss of land to assimilate nitrogen.