Download
1 / 16
160 likes | 258 Vues
Factors Affecting the Potential Role of Point-Nonpoint Trading in the Chesapeake Bay Watershed. Marc O. Ribaudo – Economic Research Service The views expressed are those of the author and not necessarily those of ERS or USDA. Point/Nonpoint Trading.

E N D
Factors Affecting the Potential Role of Point-Nonpoint Trading in the Chesapeake Bay Watershed Marc O. Ribaudo – Economic Research Service The views expressed are those of the author and not necessarily those of ERS or USDA
Point/Nonpoint Trading • Policy option that allows regulated firms to voluntarily meet discharge requirements at a lower cost than strict command-and-control • Agriculture is believed to be an important potential source of offsets when nutrients are the target pollutant • EPA and USDA are promoting point/nonpoint trading as a way of reducing pollution control costs and increasing agriculture’s contribution to reducing nonpoint source loads
Past history raises questions • Very few trades between agriculture and point sources have occurred to date in existing programs • Impediments to trades are well known • Issues in demand • Issues in supply
Baseline rules • Baseline rules establish what farmers must do to generate credits • Generally defined as management in the absence of a trading program • Timed baseline assumes that farmers will continue their current practices • Minimum Standard baseline assumes that all farmers will eventually adopt management practices used by “good stewards”
Minimum standard baseline • EPA recommends that the baseline be based on Total Daily Maximum Load (TMDL) • Where there is no TMDL, or load allocation is uncertain, then State can identify a set of “acceptable” practices that are widely believed to represent good management
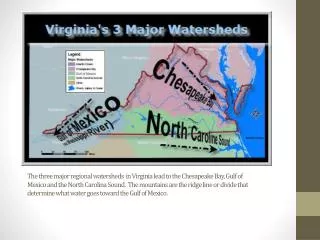
Baselines in Chesapeake Bay Watershed • Maryland • Per-acre annual loading rate calculated from TMDL allocations • Nutrient management plan (required by regulation) • Soil and water conservation plan • Pennsylvania • Buffers, or • Reducing farm’s nutrient balance by 20 percent below reductions achieved through state regulations
Baselines in Chesapeake Bay Watershed • Virginia • Soil conservation plan • Nutrient management plan • Cover crop • Exclusionary livestock fencing • Vegetative buffers
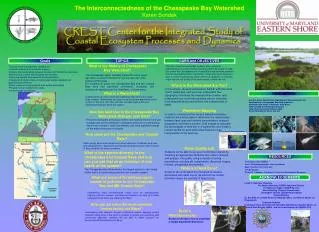
Time-based vs. Stewardship Baselines P Stewardship Timed If stewardship requirement imposed, “poor” stewards are excluded P2 P1 D C2 C1 Credits “Good” steward “Poor” steward
Conestoga watershed example Source: Analysis of representative model farms in Conestoga Watershed (Ghosh, Ribaudo, and Shortle)
How much cropland is meeting baselines (from NRCS CEAP survey)? • 13% crop acres appear to be following good nitrogen management • 17% crop acres appear to be following good phosphorus management • 9% crop acres appear to be following good N and P management • 10% crop acres appear to have edge of field buffers or filters • 4% crop acres appear to employ cover crops
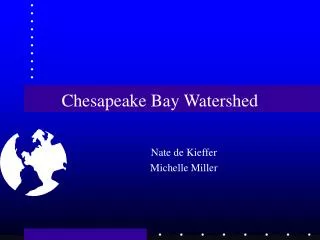
Time lags • Time frame for buyers and sellers must be aligned (temporal equivalence) • Evidence suggests that there may be significant time lags between implementing a BMP and reductions in pollutants delivered to rivers and the Bay • If not accounted for, lags present a high risk for the discharge cap being exceeded
Source: Ken Staver, presentation to Chesapeake Bay Scientific and Technical Advisory Committee, September 14, 2011.
Accounting for time lags • Allow point source to purchase future reductions by paying farmers to implement BMPs in the current period • Allow point source to purchase current reductions from farmers who have adopted BMPs in the past • A way of rewarding prior adopters? • Additionality concerns • This would require very good modeling
May not have the tools to account for lags “Time lags between land-based BMP implementation in the Bay watershed and full responses in nutrient and sediment loadings, however, remain poorly understood and have not been quantified. The existing models incorporate some of the necessary mechanisms, but others are clearly missing or are not well calibrated.” NAS, “Achieving Nutrient and Sediment Reduction Goals in the Chesapeake Bay: An Evaluation of Program Strategies and Implementation”, 2011.
Conclusions • Point/nonpoint trading has a number of design and implementation issues to address in order to be successful • Transactions costs are likely too high • Baseline rules being used by Bay states are likely to increase the cost of a credit and to limit trades • Lowest hanging fruit not addressed through trading • Most crop acres not meeting baselines
Conclusions • Use of regulations and financial incentive programs to achieve nutrient reductions “raises” the baseline and reduces potential scope of trading • Time lags between BMP implementation and delivery of reductions have not been adequately addressed • Potential risk of the discharge caps being exceeded