Download
1 / 23
240 likes | 359 Vues
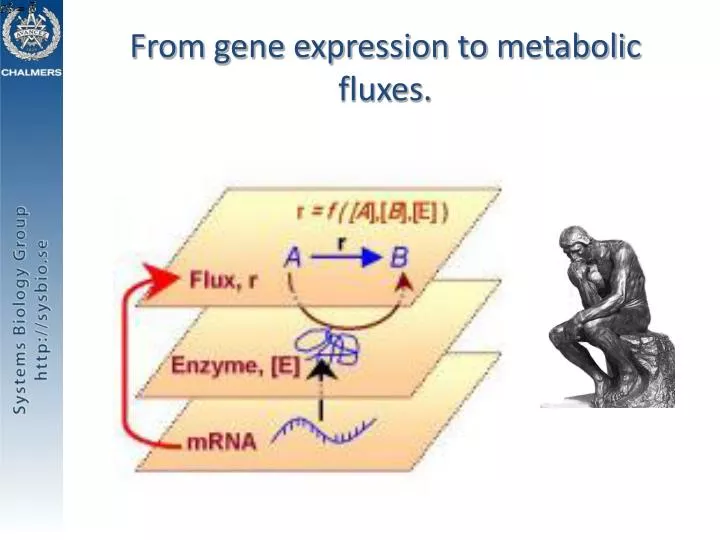
From gene expression to metabolic fluxes. . The problem to be solved (an example). Hauf, J., Zimmermann, F.K., M ü ller, S., 2000. Simultaneous genomic over expression of seven glycolytic enzymes in the yeast Saccharomyces cerevisiae. Ezyme. Microbiol. Technol. 26, 688-698.

E N D
The problem to be solved (an example) Hauf, J., Zimmermann, F.K., Müller, S., 2000. Simultaneous genomic over expression of seven glycolytic enzymes in the yeast Saccharomyces cerevisiae. Ezyme. Microbiol. Technol.26, 688-698.
Can we predict fluxes from gene expression data? There is no linear correlation.
Trancriptome and proteome Olivares R, Bordel S, Nielsen J. Codon usage variability determines the correlation between proteome and transcriptome fold changes. BMC Systems Biology. In Press.
Statistical description of gene-expression and flux changes The RNA arrays provide measurements for the significance of the expression changes in every gene. We need a method to provide measurements for the significance of flux changes in every reaction. Bordel S, Agren R, Nielsen J. Sampling the Solution Space in Genome-Scale Metabolic Networks Reveals Transcriptional Regulation in Key Enzymes. 2010. PLoSComput. Boil. 6: e1000859
Comparison between the Hit and Run algorithm and the sampling of the convex basis. The Hit and Run algorithm seems to underestimate the variance.
Some results HXK2
Transcription factor enrichment (very significant for many TFs) Transition from glucose to ethanol or acetate: Gcr1, Gcr2 and Hap4. Glucose-Ethanol 19 enzymes TR, Gcr1 in 11 of them 22 enzymes PR, Gcr1 in none of them Wild type versus grr1∆ and hxk2 ∆ mutants: Pho2 and Bas1: Regulators of purine and histidine biosynthesis. Wild type- grr1∆ 26 enzymes TR, Pho2 in 10 of them 73 enzymes PR, Pho2 in 6 of them Wild type versus mig1∆ mig2∆ mutant: Gcn4 and Cbf1: response against starvation increases growth rate by stimulating amino-acid synthesis and ribosome proliferation
The role of constraints Bordel S, Nielsen J. Identification of flux control in metabolic networks using non-equilibrium thermodynamics. 2010. Metab. Eng. 13, 369-377
How does the cell “choose” its metabolic state? Objective function Set of constraints Metabolic state + ?
Anaerobic chemostat and glucose excess batch Vemuri et. al. 2006 Batch fermentation
Thank you for your attention. Questions, suggestions, ideas?