Download
1 / 22
220 likes | 300 Vues
Coconomography Ray Madachy rjmadach@nps.edu. 25th International Forum on COCOMO and Systems/Software Cost Modeling November 2, 2010. Agenda. Coconomography Introduction Computation Method Project and Instructional Examples Instruments References. Introduction.

E N D
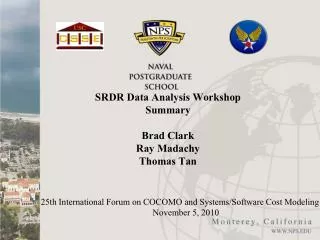
CoconomographyRay Madachyrjmadach@nps.edu 25th International Forum on COCOMO and Systems/Software Cost ModelingNovember 2, 2010
Agenda Coconomography Introduction Computation Method Project and Instructional Examples Instruments References
Introduction Coconomography is the graphical computation of constructive cost models for systems and software engineering using nomographs. They are the most rapid and simple method of calculating the models by drawing lines. No computers, calculators or manual calculations are needed. The graphs are printed on paper or used on a flat screen Nomographs are used for very fast calculations when approximate answers are appropriate and useful
COCOMO Calculator • A typical cost model nomograph for three variables computes effort in Person-Months (PM) by drawing a line between size in Kilo Source Lines of Code (KSLOC) and the Effort Adjustment Factor (EAF). • The graph layout encapsulates all the constants and variables in the formula PM = 2.94 * KSLOC^1.1 * EAF. It is plotted in logarithmic space so linear movement executes the multiplications. • Can be extended to four variables using a single calculation line. • Scale factors an be included with a contour “net diagram” replacing the straight line for PM. The contours that vary as a function of the scale factor ratings.
Possible Uses • Nomographs are the most concise representation to visualize and quantify model relationships. A sensitivity analysis is conducted by drawing multiple lines. • The input and output variables are easily switched to use effort or schedule as targets, and graphically visualize the feasible regions of the project factors. • Suppose there is a fixed target cost or timeframe. How much functionality can be incorporated with the given budget? The feasible size range is shown as the spread on the left axis from changing project factors represented on the EAF line. • The constrained ranges of organizations and their options can be visualized and easily discussed between stakeholders at a sitdown meeting. Anyone can mark them up instantly without waiting for specialists to perform a computer run. • Visual preface and summary for more detailed analyses. • The graphs can be used as crosschecks of other estimation methods and tools, or help flag their erroneous inputs.
Agenda Coconomography Introduction Computation Method Project and Instructional Examples Instruments References
Basic Nomograph Construction • Transform the COCOMO II effort equation into logarithmic space: PM = 2.94 * KSLOC1.0997 * EAFPM / 2.94 = KSLOC1.0997 * EAFlog(PM) - log(2.94) = 1.0997 * log(KSLOC) + log(EAF) • The nomograph equation for three parallel lines is: F1(u1) + F2(u2) + F3(u3) = 0 • To construct the graph set the functions to:F1(u1) = 1.0997 * log(KSLOC) F2(u2) = log(PM) - log(2.94) F3(u3) = log(EAF) F1 F2F3
Agenda Coconomography Introduction Computation Method Project and Instructional Examples Instruments
COSYSMO Effort Poster size
Effort and Schedule Ratio • Compound graphs are created by aligning common axes in relationships. • Schedule is determined from effort by drawing a line through the schedule ratio. • Note this example needs additions to calculate the cost increases when the ratio is less than unity.
Effort with Scale Factor • Solving for the Scale Factor is of the form F1(u1) = F2(u2) * F3(u3) = 0 (a diagonal line)
Visualizing Scale Factor Effects 100 K Range 10 K Range
Agenda Coconomography Introduction Computation Method Project and Instructional Examples Instruments References
Instruments Desktop and poster size nomographs Circular and linear slide rules
Aviation Usage • The slide rule still is in widespread use in aviation. • The E6B Flight Computer, or"whiz wheel", is a circular slide rule mostly used in flight training but many professional and airline pilots carry and use them. • During flight planning on the ground they aid in calculating fuel burn, wind correction, time en route, and other items. • In the air, they can be used to calculate ground speed and the back is designed for wind correction calculations. • Manual E6Bs remain far more popular than electronic ones because they are lighter, smaller, less prone to break, easy to use with one hand, quicker, and do not require electrical power. (Wikipedia)
Failed Design Goal • Five foot slide rule for conference room. • Groove mechanical tolerance became an issue due to imperfect wood warp • Two foot breadboard did not scale up • Did not check the important interfaces before applying fancy GUI (paint) • At this size the fine-grained tickmarks are precise enough to create recordable estimates in a group meeting
Agenda Coconomography Introduction Computation Method Project and Educational Examples Instruments References
References • Boehm B., Abts C., Brown W., Chulani S., Clark B., Horowitz E., Madachy R., Reifer D., Steece B., Software Cost Estimation with COCOMO II, Prentice-Hall, 2000 • Doerfler R., “Creating Nomograms with the Pynomo Software”, http://www.myreckonings.com, 2009 • Levens A.S., Nomography, Fearon Publishers, 1971 • Madachy R., “Coconomography”, http://diana.nps.edu/~madachy/coconomography/, 2010 • Pynomo, http:/pynomo.org, accessed October 2010 • Valerdi R., Systems Engineering Cost Estimation with COSYSMO, Wiley, 2011 • Wikipedia, “E6B”, accessed October 2010