Download
1 / 26
260 likes | 264 Vues
This talk provides an overview of ocean heat content estimates and uncertainties from 1950 to the present, including data types, data coverage, XBT fall-rate and bias, published estimates, controversies, and recent findings.

E N D
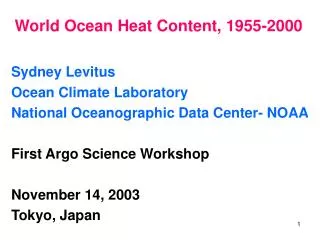
Ocean heat content: Estimates and uncertainties 1950-present Bruce Ingleby and Matt Palmer Bruce.ingleby@metoffice.gov.uk C20C, Exeter, 14 March 2007
Talk overview • Ocean data • EN3 quality control and model-free analyses • Data types and data coverage • XBTs: Fall-rate and bias • Global heat content • Published estimates and controversies • The hump in the 1970s • Differences in estimates for the 1990s • Heat content since 2003 • Summary
EN3 Data sources and processing • WOD05 – Levitus / NODC • All subsurface data types: • Ocean station/CTD, XBT, Buoys, Profilers • GTSPP from 1990-2006 • In 1990s filling a few gaps in WOD05 • Main source in last few years • ARGO data from US GODAE GDAC (1999-) • Mainly to pick up salinity corrections (~ 30%) • New climatology: EN2 1971-2000 • More effort (cf EN2) on removing biased or corrupt cruises via intervention • Ingleby and Huddleston (JMS, 2007) – EN2
EN3 products/analyses • Quality controlled observations (1950-2005) • Comprehensive set of automated checks • EN2 used by various other groups • Available on www.hadobs.org • Objective analyses (1950-2005) • Temperature and salinity • Performed as part of monthly QC cycle, using OI • 40 Z levels, 1.25° grid (0.3° N-S near equator) • No model involved: damped persistence background • Preliminary results for 2006 also available
Coverage T 0-300m: 1 – observations complete 0 – climatology only (depends on “spreading” in analysis scheme) BATHYs very important in tropics, less so in extratropics Deeper layers: coverage worse BATHYs less important
Ob-Bk mean and RMS statistics Bathy ~ 0.1C warmer than CTD Buoy biases? Differences in geographical coverage
EN3 (WOD05/GTSPP) data: Jan 1996- extra pre-ARGO profilers available cf EN2
EN3 (WOD05/GTSPP) data: Jan 2003- ARGO has since filled in S. Hem. gaps
XBT fall-rate correction • Most T-4/6/7 XBTs fall faster than original equation • Hanawa et al (1995), Zcor=Zx1.0336 • Should vary with viscosity (Thadathil el al, 2001) • In 1995/96 many ships changed to revised equation – metadata not always available • EN2/3: Check instrument type – apply correction if necessary • Ships without instrument type (and <840m) – correction applied up to and including 1996, not afterwards • If correction not applied T appears too cold • If correction applied twice then T too warm!
XBT biases? • Heinmiller et al (1983) found XBTs 0.19 (T-4) and 0.13 (T-7) warm relative to CTDs • Compared T at 25m or at depths with small T gradient to minimise impact of depth errors • Two studies (tank calibration) found smaller or zero bias • All the authors found significant probe to probe, or cruise to cruise, variability in the bias • Reseghetti et al (2006), also NRL internal reports • Gouretski and Koltermann (2007) found warm but variable XBT bias – our results similar • Undetected gross errors may be biased? • XBTs were not designed as climate-quality instruments
Recent publications on Ocean Heat Content • Levitus et al (2000, Science): “Warming of the world ocean” – L2000 • Gregory et al (2004, GRL): L2000 has too much decadal variability in OHC (or model has too little) – sampling issues • Levitus et al (2005, GRL): Oh no we don’t • Achutarao et al (2006,JGR): You might have; “Subsampling model data with actual observational coverage has a large impact on the inferred temperature variability” • Gouretski and Koltermann (2007): XBT bias • Lyman et al (2006, GRL): “Recent cooling of the upper ocean” 2003-2005
1970s hump doesn’t show in NoBT analyses Five year running mean (previous slide) emphasises 1970s hump
Ob-Bk stats Centre plot Tr Ind Max bias at 100m Suggests depth error of PALACE data
Lyman et al., [2006] Has the ocean cooled since 2003?
Summary • QC and bias issues – insufficient attention • Partly addressed here – more work needed • XBTs slightly warm – bias varies • 1970s hump: not in noBT analyses • XBT bias larger in that period • 1995-2000 Indian Ocean: PALACE data too cold – depth error • 2003-2006: decrease in OHC (all data run) • Partly due to XBT-ARGO transition + XBT bias • 1990s: increase in OHC, all analyses agree! • Bias correct XBTs by type/country/ship/year? • Look at Argo data more closely