Download
1 / 33
330 likes | 336 Vues
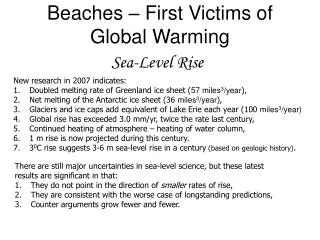
Slides for GGR 314, Global Warming Chapter 8: Sea Level Rise, Coral Reefs, and Other Marine Impacts Course taught by Danny Harvey Department of Geography University of Toronto. Recall: Exhibit 1-61a: Global mean sea level rise – 20 cm since 1880. Source: IPCC 2007, AR4, WG1, Fig. 5.13.

E N D
Slides for GGR 314,Global WarmingChapter 8: Sea Level Rise, Coral Reefs, and Other Marine ImpactsCourse taught byDanny HarveyDepartment of GeographyUniversity of Toronto
Recall: Exhibit 1-61a: Global mean sea level rise – 20 cm since 1880 Source: IPCC 2007, AR4, WG1, Fig. 5.13
Recall: Exhibit 1-62 Calculated individual contributions to the global mean sea level rise from 1961 to 2008 (left), and comparison of the sum of individual contributions with the observed sea level rise (right) Source: Church et al (2011, Geophys. Res. Lett., Vol. 38)
Recall: Exhibit 1-63: Regional variation in the sea level trend from October 1992 to July 2009, as determined by satellite altimetry. The global mean trend is +3.26 mm yr Source: Nichols and Cazenave (2010, Science, Vol. 328, 1517-20)
Exhibit 8-1: The West Antarctic, East Antarctic, and Greenland ice sheets.
Exhibit 8-2: Impact on sea level of collapse of the West Antarctic Ice sheet. The global mean sea level rise for this calculation is 3.3 m. Regional variations take into account the effects of self-gravitation, rebound of the Earth`s crust, and changes in the axis of the Earth`s rotation as mass is redistributed away from Antarctica Source: Bamber et al. (2009, Science, Vol. 324, 901-903)
Exhibit 8-3: Variation in sea level today due to the effects of ocean currents Source: Yin et al. (2009, Nature Geoscience, Vol. 2, 262-266)
Exhibit 8-4: Change in sea level from 1992-2002 to 2091-2100 due to a 43% reduction in the strength of the North Atlantic meridional overturning (the thermohaline circulation) as simulated by one AOGCM. Source: Yin et al. (2009, Nature Geoscience, Vol. 2, 262-266)
Exhibit 8-5: Distribution of dynamic sea level rise from 1992-2002 to 2091-2100 at coastal cities as simulated by 10 different AOGCMs. The centre line and top and bottom of the boxes correspond to the 50th, 25th and 75th percentiles, respectively, while top and bottom whiskers correspond to the 5th and 95th percentiles, respectively. Source: Yin et al. (2009, Nature Geoscience, Vol. 2, 262-266)
Exhibit 8-7: These sub aerial roots serve to dampen the effects of storm surges and tsunami.
Exhibit 8-10: Impact of sea level rise on the freshwater lens below an island.
Exhibit 8-11:Staghorn Acropora coral before and after bleaching
Exhibit 8-12: Bleached coral (foreground) and normal coral (background) Source: Wikipedia, article on Coral Bleaching
Exhibit 8-14: White plague disease on Dichocoenia stokesii Source: Science, Vol. 318, 1716
Initial chemical reactions when CO2 is absorbed by water Source: Ocean Acidification, Questions Answered (www.epoca-project.eu)
Exhibit 8-15: Measured variation in atmospheric CO2, in the CO2 partial pressure in surface water, and in surface water pH Source: Ocean Acidification, Questions Answered (www.epoca-project.eu)
Exhibit 8-16: Peak reduction in surface layer pH as a function of the total release of CO2 and the time over which it is released. Source: Zeebe et al. (2008; Science 321, 51)
Exhibit 8-17: Percent of CaCO3 in sediments of PETM age and on the ocean floor at various depths.A massive (2000-5000 Gt C) injection of CO2 into the atmosphere over a 1000-10000 yr period at the start of the PETM (55.0 million years ago) caused much of the ocean volume to become unsaturated with respect to calcium carbonate, with the result that almost no calcareous sediments were formed. Full recovery took 100,000 years, as seen in the data presented here. Source: Ocean Acidification, Questions Answered (www.epoca-project.eu)
Exhibit 8-18: Hard coral is generally made of aragonite – the first carbonate mineral to dissolve as the CO32- concentration in seawater decreases Photo sources: Wikipedia article on “Coral” (authors: Adona6, Nick Hobgood, and William Harrigan, NOAA Corps (ret.), respectively)
Exhibit 8-19: The sea urchin Echinus esculentus (left) has a calcite test, while the pteropod Cuvierina columnella (right) has an arogonite shell. Source: Ocean Acidification, Questions Answered (www.epoca-project.eu)
Exhibit 8-20: Growth of a marine bivalve in seawater exposed to different atmospheric CO2 concentrations 250 ppm 390 ppm 750 ppm 1500 ppm Source: Talmage and Gobler (2010, Proc. Nat. Acad. Sci., Vol. 107, 17246-17251)
Exhibit 8-21: Growth of a marine bivalve in seawater exposed to different atmospheric CO2 concentrations 250 ppm 390 ppm 750 ppm 1500 ppm Source: Talmage and Gobler (2010, Proc. Nat. Acad. Sci., Vol. 107, 17246-17251)
Exhibit 8-22: The mass of shells of the planktonic foraminifer Globigerina bulloides (left) has varied inversely with CO2 concentration during the past 50,000 years, according to measurements from ocean sediments (right). Samples from recent ocean sediments indicate a decrease in the average mass of present-day shells by 30-35% since the start of the industrial revolution. Source: Ocean Acidification, Questions Answered (www.epoca-project.eu)
Exhibit 8-23: pH of ocean surface water as calculated by the NCAR AOGCM for conditions in 1875 and 1995 and as projected for 2050 and 2095 Source: Ocean Acidification, Questions Answered (www.epoca-project.eu)
Exhibit 8-24: The supersaturation factor (ratio of CO32- concentration to the concentration required for saturation) for aragonite in surface waters in equilibrium with atmospheric CO2 concentrations of 280 ppmv and 750 ppmv. The histograms show the frequency distribution of the supersaturation factor among grid cells (indicated by magenta) where coral reefs occur Aragonite dissolves Source: Cao and Caldeira (2008, Geophys. Res. Lett., Vol. 35, L19609)
Exhibit 8-25: Coral reef growth rates as a percent of present growth rates (which have already likely been reduced by 20% or more compared to pre-industrial rates) due to the combined effects of decreasing carbonate supersaturation and the direct effects of warmer temperatures Source: Silverman et al (2009, Geophys. Res. Lett., Vol. 36, L05606)
Exhibit 8-26: Same as Exhibit 8-25, but accounting for effects of coral bleaching Source: Silverman et al (2009, Geophys. Res. Lett., Vol. 36, L05606)
Exhibit 8-27: Five major extinction events have occurred in the Earth’s history, each leaving the world without coral reefs for millions of years Periods without coral reefs Periods of massive reef building “By process of elimination, primary causes of mass extinctions are linked in various ways to the carbon cycle in general and ocean chemistry in particular with clear association with atmospheric carbon dioxide levels. The prospect of ocean acidification is potentially the most serious of all predicted outcomes of anthropogenic carbon dioxide increase” Source of quote and figure: Veron (2008, Coral Reefs 27, 459-472)