Download
1 / 1
10 likes | 92 Vues
1 2 3 4 5 6 7 8 9. ~82 kDa. ~49 kDa. RESULTS. MATERIALS AND METHODS

E N D
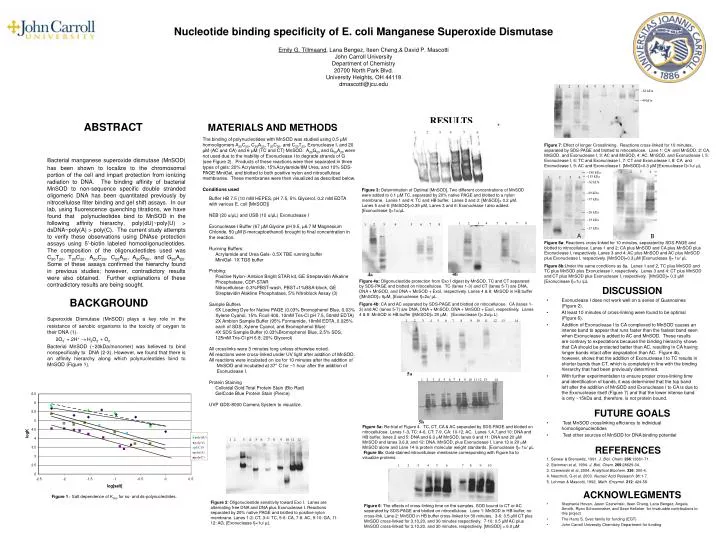
1 2 3 4 5 6 7 8 9 ~82 kDa ~49 kDa • RESULTS • MATERIALS AND METHODS • The binding of polynucleotides with MnSOD was studied using 0.5 µM homooligomers A20C20, C20A20, T20C20, and C20T20, Exonuclease I, and 20 µM (AC and CA) and 6 µM (TC and CT) MnSOD. A20G20 and G20A20 were not used due to the inability of Exonuclease I to degrade strands of G (see Figure 2). Products of these reactions were then separated in three types of gels: 20% Acrylamide, 15%Acrylamide/8M Urea, and 10% SDS-PAGE MiniGel, and blotted to both positive nylon and nitrocellulose membranes. These membranes were then visualized as described below. • Conditions used • Buffer HB 7.5 (10 mM HEPES, pH 7.5, 5% Glycerol, 0.2 mM EDTA • with various E. coli [MnSOD]) • NEB (20 u/µL) and USB (10 u/µL) Exonuclease I • Exonuclease I Buffer (67 µM Glycine pH 9.5, µ6.7 M Magnesium Chloride, 50 µM β-mercaptoethanol) brought to final concentration in the reaction. • Running Buffers: • Acrylamide and Urea Gels- 0.5X TBE running buffer • MiniGel- 1X TGS buffer • Probing: • Positive Nylon- Ambion Bright STAR kit, GE Streptavidin Alkaline Phosphatase, CDP-STAR • Nitrocellulose- 0.3%PBST-wash, PBST+1%BSA-block, GE Streptavidin Alakline Phosphatase, 5% Nitroblock Assay (3) • Sample Buffers • 6X Loading Dye for Native PAGE (0.03% Bromophenol Blue, 0.03% Xylene Cyanol, 15% Ficoll 400, 10mM Tris-Cl pH 7.5, 50mM EDTA) • 2X Ambion Sample Buffer (95% Formamide, 18mM EDTA, 0.025% each of SDS, Xylene Cyanol, and Bromophenol Blue) • 4X SDS Sample Buffer (0.03%Bromophenol Blue, 2.5% SDS, 125mM Tris-Cl pH 6.8, 20% Glycerol) • All crosslinks were 3 minutes long unless otherwise noted. • All reactions were cross-linked under UV light after addition of MnSOD. • All reactions were incubated on ice for 10 minutes after the addition of • MnSOD and incubated at 37° C for ~1 hour after the addition of • Exonuclease I. • Protein Staining • Colloidal Gold Total Protein Stain (Bio Rad) • GelCode Blue Protein Stain (Pierce) • UVP GDS-8000 Camera System to visualize. 1 2 3 4 5 6 Figure 7: Effect of longer Crosslinking. Reactions cross-linked for 10 minutes, separated by SDS-PAGE and blotted to nitrocellulose. Lane 1: CA and MnSOD, 2: CA, MnSOD, and Exonuclease I, 3: AC and MnSOD, 4: AC, MnSOD, and Exonuclease I, 5: Exonuclease I, 6: TC and Exonuclease I, 7: CT and Exonuclease I, 8: CA and Exonuclease I, 9: AC and Exonuclease I. [MnSOD]=0.3 µM [Exonuclease I]=1u/ µL Nucleotide binding specificity of E. coli Manganese Superoxide DismutaseEmily G. Tillmaand, Lana Bengez, Iteen Cheng,& David P. MascottiJohn Carroll UniversityDepartment of Chemistry20700 North Park Blvd.University Heights, OH 44118dmascotti@jcu.edu 1 2 3 4 ~180 kDa ~115 kDa 1 2 3 4 ~82 kDa Figure 3: Determination of Optimal [MnSOD]. Two different concentrations of MnSOD were added to 0.1 µM TC, separated by 20% native PAGE and blotted to a nylon membrane. Lanes 1 and 4: TC and HB buffer. Lanes 2 and 3: [MnSOD]= 0.2 µM. Lanes 5 and 6: [MnSOD]=0.35 µM, Lanes 3 and 6: Exonuclease I also added. [Exonuclease I]=1u/µL ~49 kDa ~37 kDa ~26 kDa ~19 kDa 1 2 3 4 5 6 7 8 1 2 3 4 5 6 7 8 ~15 kDa A B Figure 8a: Reactions cross-linked for 10 minutes, separated by SDS-PAGE and blotted to nitrocellulose. Lanes 1 and 2: CA plus MnSOD and CA plus MnSOD plus Exonuclease I, respectively. Lanes 3 and 4: AC plus MnSOD and AC plus MnSOD plus Exonuclease I, respectively. [MnSOD]=0.3 µM [Exonuclease I]= 1u/ µL Figure 8b:Under the same conditions as 8a. Lanes 1 and 2, TC plus MnSOD and TC plus MnSOD plus Exonuclease I, respectively. Lanes 3 and 4: CT plus MnSOD and CT plus MnSOD plus Exonuclease I, respectively. [MnSOD]= 0.3 µM [Exonuclease I]=1u /µL 4b 4a Figure 4a: Oligonucleotide protection from Exo I digest by MnSOD. TC and CT separated by SDS-PAGE and blotted on nitrocellulose. TC (lanes 1-3) and CT (lanes 5-7) are DNA, DNA + MnSOD, and DNA + MnSOD + ExoI, respectively. Lanes 4 & 8: MnSOD in HB buffer ([MnSOD]= 6µM, [Exonuclease I]=2u/ µL Figure 4b: CA and AC separated by SDS-PAGE and blotted on nitrocellulose. CA (lanes 1-3) and AC (lanes 5-7) are DNA, DNA + MnSOD, DNA + MnSOD + ExoI, respectively. Lanes 4 & 8: MnSOD in HB buffer ([MnSOD]= 20 µM, [Exonuclease I]= 2u/µ L) • DISCUSSION • Exonuclease I does not work well on a series of Guanosines (Figure 2). • At least 10 minutes of cross-linking were found to be optimal (Figure 6). • Addition of Exonuclease I to CA complexed to MnSOD causes an intense band to appear that runs faster than the fastest band seen when Exonuclease is added to AC and MnSOD. These results are contrary to expectations because the binding hierarchy shows that CA should be protected better than AC, resulting in CA having longer bands intact after degradation than AC. Figure 4b, however, shows that the addition of Exonuclease I to TC results in shorter bands than CT, which is completely in line with the binding hierarchy that had been previously determined. • With further experimentation to ensure proper cross-linking time and identification of bands, it was determined that the top band left after the addition of MnSOD and Exonuclease I to CA is due to the Exonuclease itself (Figure 7) and that the lower intense band is only ~15kDa and, therefore, is not protein bound. • FUTURE GOALS • Test MnSOD crosslinking efficiency to individual homooligonucleotides • Test other sources of MnSOD for DNA binding potential • REFERENCES • 1. Senear & Brenowitz, 1991. J. Biol. Chem. 266:13661-71. • 2. Steinman et al, 1994. J. Biol. Chem. 269:28629-34. • 3. Czerwinski et al, 2004. Analytical Biochem. 336: 300-4. • 4. Neschich, G et al. 2003. Nucleic Acid Research. 31:1-7. • 5. Lohman & Mascotti, 1992. Meth. Enzymol. 212: 424-58. • ACKNOWLEGMENTS • Stephanie Hovan, Jason Czerwinski, Iteen Cheng, Lana Bengez, Angela Smolik, Ryan Schoonmaker, and Sean Kellaher for invaluable contributions to this project • The Harry S. Svec family for funding (EGT) • John Carroll University Chemistry Department for funding ABSTRACT Bacterial manganese superoxide dismutase (MnSOD) has been shown to localize to the chromosomal portion of the cell and impart protection from ionizing radiation to DNA. The binding affinity of bacterial MnSOD to non-sequence specific double stranded oligomeric DNA has been quantitated previously by nitrocellulose filter binding and gel shift assays. In our lab, using fluorescence quenching titrations, we have found that polynucleotides bind to MnSOD in the following affinity hierarchy, poly(dU)~poly(U) > dsDNA~poly(A) > poly(C). The current study attempts to verify these observations using DNAse protection assays using 5’-biotin labeled homooligonucleotides. The composition of the oligonucleotides used was C20T20, T20C20, A20C20, C20A20, A20G20, and G20A20. Some of these assays confirmed the hierarchy found in previous studies; however, contradictory results were also obtained. Further explanations of these contradictory results are being sought. BACKGROUND Superoxide Dismutase (MnSOD) plays a key role in the resistance of aerobic organisms to the toxicity of oxygen to their DNA (1). 2O2- + 2H+ H2O2 + O2 Bacterial MnSOD (~20kDa/monomer) was believed to bind nonspecifically to DNA (2-3). However, we found that there is an affinity hierarchy along which polynucleotides bind to MnSOD (Figure 1). 1 2 3 4 5 6 7 8 9 10 11 12 13 14 5a 1 2 3 4 5 6 7 8 9 10 11 12 13 14 5b ▲poly(dU) Figure 5a: Re-trial of Figure 4.TC, CT, CA & AC separated by SDS-PAGE and blottedon nitrocellulose.Lanes 1-3, TC: 4-6, CT: 7-9, CA: 10-12, AC. Lanes 1,4,7,and 10: DNA and HB buffer, lanes 2 and 5: DNA and 6.0 mM MnSOD, lanes 8 and 11: DNA and 20 µM MnSOD and lanes 3,6,9, and 12: DNA, MnSOD, plus Exonuclease I. Lane 13 is 20 mM MnSOD alone and Lane 14 is protein molecular weight standards. [Exonuclease I]= 1u/ µLFigure 5b: Gold-stained nitrocellulose membrane corresponding with Figure 5a to visualize proteins. 1 2 3 4 5 6 7 8 9 10 11 12 poly(U) ●pUC19 ■poly(A) ■poly(C) 1 2 3 4 5 6 7 8 9 10 Figure 1 : Salt dependence of Kobs for ss- and ds-polynucleotides. Figure 2: Oligonucleotide sensitivity toward Exo I. Lanes are alternating free DNA and DNA plus Exonuclease I. Reactions separated by 20% native PAGE and blotted to positive nylon membrane. Lanes 1-2: CT, 3-4: TC, 5-6: CA, 7-8: AC, 9-10: GA, 11-12: AG. [Exonuclease I]=1u/ µL Figure 6: The effects of cross-linking time on the samples. SOD bound to CT or AC separated by SDS-PAGE and blotted on nitrocellulose. Lane 1: MnSOD in HB buffer, no cross-link. Lane 2: MnSOD in HB buffer cross-linked for 30 minutes. 3-6: 0.5 µM CT plus MnSOD cross-linked for 3,10,20, and 30 minutes respectively. 7-10: 0.5 µM AC plus MnSOD cross-linked for 3,10,20, and 30 minutes, respectively. [MnSOD] = 6.0 µM