Download

1 / 27
400 likes | 909 Vues
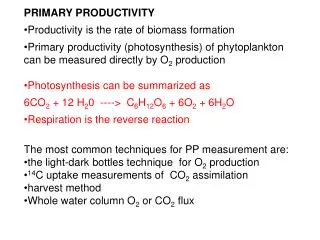
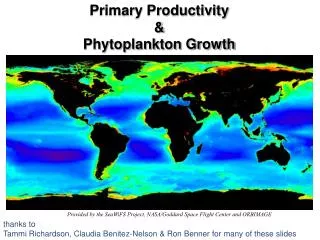
Primary Productivity. “Ultimately, what limits the productivity if the environment is whatever limits the productivity of the producers.” ~ Dr. Tom Langen. Net Primary Productivity (NPP) a.k.a. Plant Growth.

E N D
“Ultimately, what limits the productivity if the environment is whatever limits the productivity of the producers.” ~Dr. Tom Langen
Net Primary Productivity (NPP) a.k.a. Plant Growth • The annual net production of biomass by producers (gross production minus the portion lost in respiration) • Limiting factors (for plants): • Light • Carbon (CO2) • Temperature • Water • Nutrients: Nitrogen, Phosphorus, Potassium
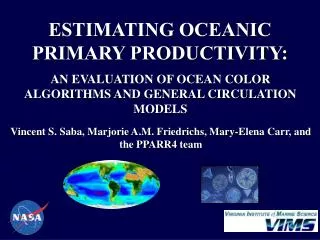
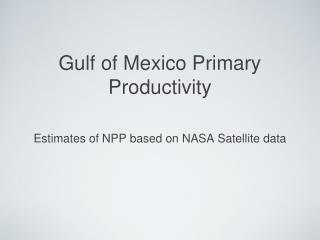
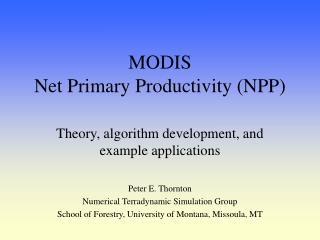
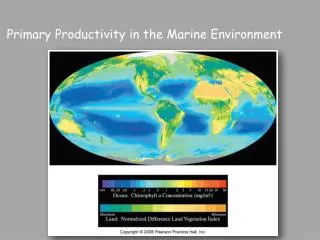
Areas of Red are highest NPP, Yellow and Green are moderate NPP, and Blue is lowest NPP
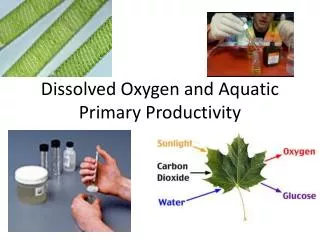
Carbon Fixation in Plants • In the final stage of photosynthesis, called the Calvin Cycle, enzymes within the plant cells are used to incorporate carbon atoms from CO2 into organic molecules. This is called carbon fixation: taking the C from a gas and incorporating it into the plant. • The Calvin Cycle is one of 3 ways carbon can be fixed into the plant tissue. • The Calvin Cycle occurs in all plants and algae and uses enzymes found in the stroma of the chloroplast. • In the one stage of the cycle, a total of 6 CO2 molecules must enter the Calvin Cycle to produce one 6 carbon sugar molecule.
Net Primary Productivity (NPP) Light & Temperature • Light not limiting, as long as the appropriate wavelengths are present (excludes night, deep ocean, deep shade) • Only 1% of sunlight (8% of optimal wavelengths) falling on a plant used for photosynthesis • Temperature must be with a range for optimal metabolic (enzyme) activity
Net Primary Productivity (NPP) Water • Threshold amount of water necessary for metabolic activity & to provide support (prevent wilting) • Water transport (roots to leaves = evapotranspiration) sets rate of nutrient transport • Tradeoff: opening pores to acquire CO2 (carbon dioxide) results in water loss
Evapotranspiration: The amount of water used by plants through their roots (evaporation from the soil) and used/lost through their leaves (transpiration).
Gross Primary Productivity (GPP) • The rate at which an ecosystem’s producers convert solar energy into chemical energy as biomass (fixation). • Biomass Usage • The rate at which producers use the chemical energy stored as biomass (through aerobic respiration) = NPP NPP is the rate at which energy for use by consumers is stored in new biomass (cells, leaves, etc). What is left over after the plant uses its amount for metabolism.
Net Primary Productivity (NPP) • Carbon • Rate of carbon fixation sets the maximum rate of plant growth… plants are CO2 limited. • So talk to your plants!!! • Nutrients • Typical fertilizers are NPK: nitrogen, phosphorus, potassium • Nitrogen often limiting in temperate forests and oceans, phosphorus limiting in tropical forests and rivers/lakes
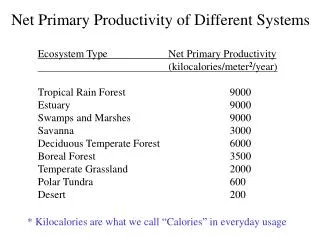
Where is NPP highest? • Wet tropics (900 g C/m2/yr) • Sufficient light (in canopy), ideal temperature, plenty of water • Nutrients limiting: soils are often poor, nutrients locked up in biomass • Inshore oceans (225 - 900 g C/m2/yr) • Upwelling of nutrients from deep ocean on shallow continental shelves • Tropical swamps, rivers & lakes (1125 g C/m2/yr) • Same reasons as wet tropical forest • Oxygen sometimes limiting (used up in respiration)
Where is NPP lowest? • Deserts (1.5 - 32 g C/m2/yr) • Conservative with water (low CO2 fixation) • Temperature often dangerously high • Arctic tundra (65 g C/m2/yr) • Temperature too low, water unavailable (ice), light low for half the year • Cold Northern rivers & lakes • Nutrients scarce, cold temperature slows metabolic activity • Open ocean (57 g C/m2/yr) • Nutrients scarce (nitrogen & iron especially)
The storage of biomass can be represented at trophic levels as a biomass pyramid • How much life can be supported by the biomass available? • How rapidly do producers in different ecosystems produce biomass? • Why can’t humans just eat phytoplankton? • Humans waste up to 60% of all of the worlds NPP.
Biogeochemical Cycles • Nitrogen • Carbon • Water • Oxygen
Nitrogen Cycle • Fixation-N2 conversion to a solid via bacteria • Assimilation- nitrate (NO3) or ammonium (NH4) can be absorbed through plant roots. • Ammonification-bacteria convert decomposing animals nad plants back to ammonium • Denitrification-converting nitrogen compounds to nitrogen gas.