Download
1 / 16
160 likes | 325 Vues
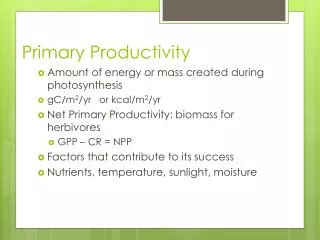
PRIMARY PRODUCTIVITY. ASHTON CAUDLE, PATRICIA MULLER, SARAH RUTLAND, MATT EVANS, & ROY KIM. The main source of energy for primary production is sunlight, which is one of the three reactants of photosynthesis. . BACKGROUND:. WHAT IS PRIMARY PRODUCTIVITY?.

E N D
PRIMARY PRODUCTIVITY ASHTON CAUDLE, PATRICIA MULLER, SARAH RUTLAND, MATT EVANS, & ROY KIM
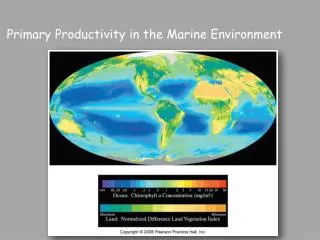
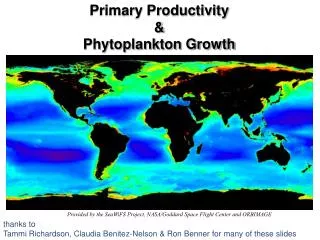
The main source of energy for primary production is sunlight, which is one of the three reactants of photosynthesis. BACKGROUND: WHAT IS PRIMARY PRODUCTIVITY? Primary productivity is the production of organic compounds from atmospheric or aquatic carbon dioxide mainly through the process of photosynthesis. Almost all life on earth is directly or indirectly reliant on primary production.
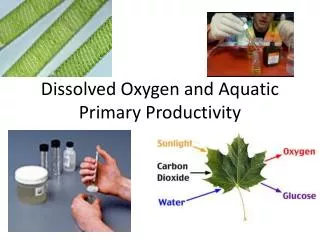
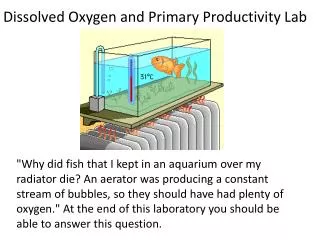
Light Our Experiment: • For this experiment, we tested the rate at which photosynthesis and cellular respiration occurs within algae. We used different light intensities to vary the amount of light energy that will come into the algae to be converted to chemical energy and oxygen. To record this data we measured the amount of dissolved oxygen to find the productivity of the algae.
PROBLEM STATEMENT: How will exposure to certain amounts of light affect the levels of dissolved oxygen in a sample of solution and therefore the productivity in that solution?
HYPOTHESIS As the intensity of the light source increases, independent variable = light intensity dependent variable = net and gross productivity. the producer will have a greater amount of dissolved oxygen, making the productivity greater.
MATERIALS: • 7 BOD bottles • Chlorella culture • gloves, • manganous sulfate • starch indicator • sulfamic acid and a measuring spoon • Rubber bands • 2 titration syringes • 2 20-mL sampling vials • 17 fiberglass screens • small sheet of aluminum foil • marker • 60-mL syringe • alkaline potassium iodide azide • sodium thiosulfate
PROCEDURE: Day 1 • Create a Baseline- Fill a bottle with pond water and cap. Determine DO by following the Winkler Method protocol. • Light and Dark Bottle- Fill two bottles with pond water. Wrap one bottle with aluminum foil to exclude all light (dark bottle). Leave the other uncovered. Leave the bottles under florescent light overnight. • Simulated Depth Samples- Fill four bottles with pond water. Cover one with one fiberglass screen, one with three screens, one with five screens, and one with eight screens. Secure screens with rubber band. Leave the bottles under florescent light overnight.
Procedure: Day 2 • Determine the dissolved oxygen of sample bottles by following the Winkler Method Protocol.
OBSERVATIONS The pond water started out as a greenish-clear color with green algae in the bottom After the solutions were fixed, they turned a pale yellow color. The less light intensity the bottles were exposed to, the darker they appeared. After adding starch indicator, the solution turned purple. As the titration with the sulfate progressed, the purple solution at the endpoint turned clear. When the Winkler Method was finished there was an algae precipitate
ANALYSIS dissolved oxygen levels (productivity) light intensity (% light)
ANYLSIS: Calculations Loss due to respiration: Dissolved oxygen baseline sample- dissolved oxygen 0% light **This shows how much oxygen respiration used Net Productivity (oxygen left after respiration) Dissolved oxygen sample x% light - dissolved oxygen baseline sample **This shows the productivity after both photosynthesis and respiration have occurred Gross Productivity (total amount of dissolved oxygen) Net productivity + loss due to respiration **This shows productivity just by photosynthesis alone
These values we got from our experiment These are the values we calculated
CONCLUSION Based on the data collected, our hypothesis was supported because as the light intensity increased, the gross productivity and net productivity also increased.
DISCUSSION QUESTIONS #1 Q) At approximately what light intensity does the rate of respiration equal the rate of photosynthesis? A) By looking at the graph we see that at approx. 18% light intensity the producer has neither a negative or positive productivity, but is at equilibrium.
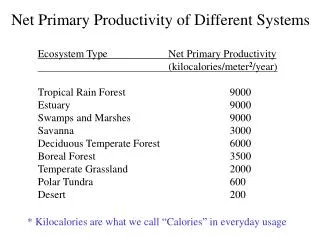
#2 Q) At approximately what depth in the simulated pond does this occur? A) From the table we see that 3 screens simulate a 2.0 meter pond depth and 5 screens simulate a 3.0 meter pond depth. Therefore we can conclude that for 18% light, the depth of the pond would be approximately 2.5 meters.