Download
1 / 13
260 likes | 653 Vues
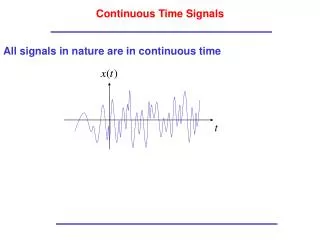
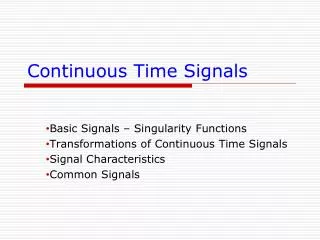
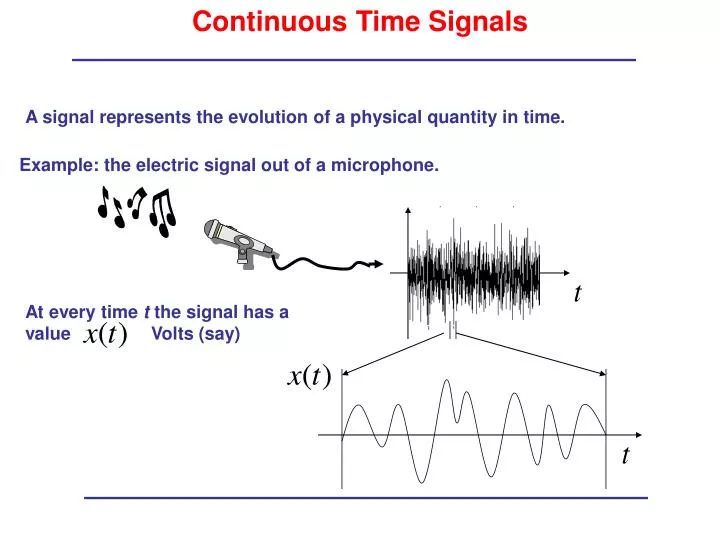
Continuous Time Signals. A signal represents the evolution of a physical quantity in time. Example: the electric signal out of a microphone. At every time t the signal has a value Volts (say). Digital Processing of Continuous Time Signals. ADC. DSP. DAC.

E N D
Continuous Time Signals A signal represents the evolution of a physical quantity in time. Example: the electric signal out of a microphone. At every time t the signal has a value Volts (say)
Digital Processing of Continuous Time Signals ADC DSP DAC • Signals can be processed numerically by a digital computer or using a DSP chip. We need: • Analog to Digital Converter (ADC): convert the signal to a numerical sequence • Digital to Analog Converter (DAC): convert it back to analog, if we need to.
Analog to Digital Converter (ADC) ADC It performs Sampling and Quantization. Parameters: Sampling interval (sec) Sampling frequency (Hz=1/sec) Number of Bits per Sample
Digital to Analog Converter (DAC) DAC It converts a signal back to Continuous Time by holding the value within the sampling interval.
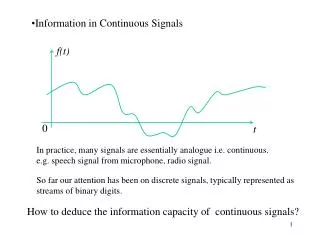
Energy of a Signal A signal represents a physical quantity, like a Voltage, a Current, a Pressure … We define its total Energy as: Example:
Power of a Signal A signal represents a physical quantity, like a Voltage, a Current, a Pressure … We define the Average Power: In particular if the signal is a periodic repetition of a pulse:
Example Take a square wave. Suppose it is a voltage and the values are in Volts: Its square root is called the Root Mean Square (RMS) value:
Relative Power: deciBells (dBs) In many problems we are interested in the relative power, with respect to the power of a reference signal. For example, suppose the reference has a power Then, in the previous example: You could use the RMS values and obtain the same result:
Some Typical Values for Acoustic Signals Take the air pressure of an audio signal. Let the reference be the threshold of hearing. For a typical person this
Signal to Noise Ratio noise signal what we get Usually all the signals we don’t want we call them “noise”. This can be caused by actual background noise, interference from another source (someone talking during the movie) or any other undesired sources. The Signal to Noise Ratio (SNR) characterizes how “noisy” the signal is:
Example 1. You hearing something at a level “f”(forte), and someone talks at level “ppp” (pianissimo), then the SNR is (refer to the table): 2. You hearing something at a level “f”(forte), and someone talks at level “p” (piano), then the SNR is (refer to the table):
Quantization Noise original quantized error Back to Discrete Time Signals. When we quantize a signal with a finite number of bits, we introduce errors which are perceived as noise. Problem: what is the relation between number of bits per sample and SNR? For an average signal, statistically it can be shown that: Then
Example We want to determine the number of bits per sample to obtain a good SNR of at least 100dB. Then we need: which yields Then we need at least 16 bits per sample.