Download
1 / 36
360 likes | 533 Vues
Practicing Science Ch.1 lesson 1-5. Table of Contents Skills of Science Measurement in Science Math in Science Graphs Doing Experiments. Vocabulary 1.1. Science- a way of learning about the natural world through observations and logical reasoning; leads to a body of knowledge.

E N D
Practicing Science Ch.1 lesson 1-5 Table of Contents Skills of Science Measurement in Science Math in Science Graphs Doing Experiments
Vocabulary 1.1 • Science-a way of learning about the natural world through observations and logical reasoning; leads to a body of knowledge. • Observing-The process of using one or more of your senses to gathr information. • Quantitative Observation-an observation that deals with a number or amount. • Qualitative observation- Observation that deals with characteristics that cannot be expressed in numbers. • Inferring- the process of making and interpretation based on observation and prior knowledge. • Predicting- the process of forecasting what will happen in the future based on past experiences. • Classifying-the process of grouping together items that are alike in some way. • Making models- the process of creating representations of complex objects or processes. • Evaluating- comparing observations and data to reach a conclusion • Scientific investigation about them.
Skills of Science pg. 9 Predicting Whale Behavior Humpback whales eat krill, tiny shrimp-like animals. These panels show a sequence of humpback whale feeding behavior. What do you think will be happen next?
What Skills Do Scientist Use? • When you explain or interpret the things you observe, you are inferring, or making an inference. (Inferring is not guessing.) Inferences are based on reasoning from what you already know. • Example: has four legs, has fur, use as a house pet, loves wagging their tail, ___________(inference) • Predicting means making a statement or claim about what will happen in the future based on past experience or evidence. • Example: Looks grey and cloudy- it’s going to rain (prediction) • .
What Skills Do Scientist Use? • Predictions and inferences are closely related. While inferences are attempts to explain what is happening or has happened, predictions are statements of claims about what will happen. • Classifying is the grouping together of items that are alike in some way. • Evaluating involves comparing observations and data to reach a conclusion about them
What Skills Do Scientist Use? Pg. 11 • Making Models involves creating representations of complex objects or processes. Some models can be touched, such as a map. Others are in the form of mathematical equations or computer programs. Models help people study things that can’t be observed directly.
What Skills Do Scientist Use? Pg.9,10 • Predictions and inferences are closely related. While inferences are attempts to explain what is happening or has happened, predictions are statements of claims about what will happen. • Classifying is the grouping together of items that are alike in some way. • Evaluating involves comparing observations and data to reach a conclusion about them
APPLY IT!! Skills of Science pg. 10 Ocean Surface Temperature The map shows ocean surface temperature along the Florida coast in December. Read Q.
Planning and Carrying Out an Investigation pg. 11 • Planning and carrying out an investigation may use many of the scientific skills (observing, inferring, predicting, classifying, evaluating, and making models.) • It may also involve identifying: • variables (a factor that can change in an experiment) • Independent variables (the one factor that a scientist changes during an experiment)are changed to test a hypotheses. • Hypothesis: A possible explanation for a set of observations or answers to a scientific question(must be testable) • Dependent variables (the factor that changes in an experiment)change in response to the independent variables.
Figure 4 pg. 11 • For each image, write a question that could be answered by conducting a scientific investigation. • 1._______________________________________________________________________________________________________________ • 2.________________________________________________________________________________________________________________ • Assess your under. Pg. 11
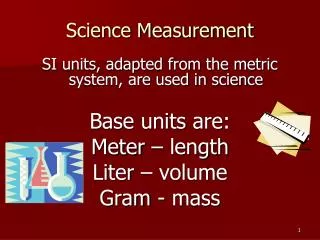
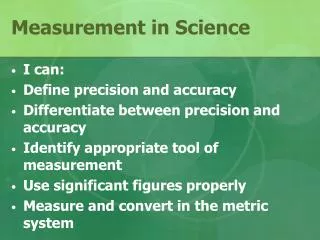
Vocabulary 1.2 • Metric System-Is a measurement system based on the number 10. • International System of units (SI)- Modern scientists use a version of the metric system • Mass- • Weight- • Volume- • Density-
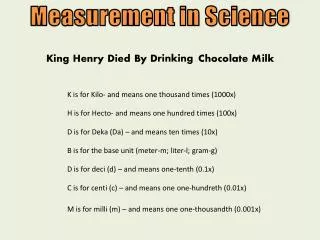
Why Do Scientist Use a Standard Measurement System? Pg. 13 • Standard measurement allows scientists everywhere to repeat experiments. • In the 1790’s, scientists in France developed a universal system of measurement called the metric system. • The metric system is a system of measurement based on the number 10. • SI (International System Units) • Modern scientists use a version of the metric system called the International System of Units, or SI. • Using SI as the standard system of measurement allows scientists to compare data and communicate with each other about their results.
Figure 1 Measurement in Science pg. 13 Common SI Prefixes The metric system is used to measure things like length, mass, and volume. How would you complete the chart of SI prefixes? Assess your Understanding pg. 13
What are Some SI Units of Measure? Pg. 14 • Scientist measure things regularly such as: • Length, mass, volume, density, temperature, and time. • They are all measured in SI unit. • In the SI system, the basic unit for measuring length is the meter (m). SI unit • Length= (M) Meter • Mass= (Kg) Kilograms • For lengths smaller than a meter, the centimeter (cm) and millimeter (mm) are used. The kilometer (km) is used for measuring long distances. • Figure 2
Measurement in Science pg.14 Conversions for Length A meter (m) is the basic SI unit used for measuring length.
What are Some SI Units of Measure? Pg. 15 • Mass is a measure of the amount of matter in an object. • Mass is measured with a balance (comparing the mass of an object to a known mass) • In SI system, the basic unit for measuring mass is the kilogram (kg). • SI unit • Mass= (Kg) Kilograms • To measure smaller masses= grams (g) and milligrams (mg) are used. • Unlike mass, weightis a measure of the force of gravity acting on an object. A scale is used to measure weight. • Triple beam balance used to measure mass • Figure 3
Measurement in Science pg. 15 Conversions for Mass In SI, the basic unit for measuring mass is the kilogram (kg) SI unit Mass= (Kg) Kilograms
Volume pg. 17 • Volumeis the amount of space an object or substance takes up. • In SI, the basic unit for measuring volume is the cubic meter (m³). • SI unit • Volume the cubic meter (m³) • A cubic meter is equal to the volume of a cube with 1-meter sides. Use cubic meters to measure the volume of solids. • To measure the volume of a liquid, use the liter (L), and read the level at the bottom of the meniscus, or curve. • To measure the volume of an irregular solid, use the displacement method • Displacement Method: immerse the object in water • and measure how much the water level rises. • FIGURE 5 pg. 17
Measurement in Science pg. 16 Conversions for Volume This table shows how to convert between the volume of solids and the volume of liquids .
Formula to calculate the volume of a rectangular solid • Volume= Length x width x height
What are Some SI Units of Measure? Pg. 18 • The density of an object is the object’s mass divided by its volume. • Formula to find density of an object: • Density= _Mass (amount of matter) • Volume (space of an object) • Density, a measure of how much mass(the amount of matter in an object) much is contained in a given volume (is the amount of space an object or substance takes up) is expressed as a relationship between two units. • In SI, the basic unit for measuring density is kilograms per cubic meter (kg/m³) SI unit • Density kilograms per cubic meter (kg/m³).
Figure. 7 Measurement in Science pg.19 Densities of Some Common Substances The density of water is 1 g/cm3. According to the chart, which substances will float in water?
What are Some SI Units of Measure? Pg. 20 • In addition to the Celsius scale, scientists sometimes use another temperature scale, called the Kelvin scale. In fact, the Kelvin (K) is the official SI unit for temperature. A thermometer is used to measure temperature. • SI unit • Temperature The Kelvin scale (K) • The second (s) is the SI unit used to measure time. • SI unit • Time The Second (s)
Measurement in Science pg. 20 Conversions for Temperature The Kelvin scale is the basis for the SI temperature units.
Figure 8 Measurement in Science pg. 20 Temperature Scales Which thermometer is Kelvin? Which is Celsius? What is the freezing point on the Kelvin thermometer?
Time pg. 21 • Time is a measurement of the period between 2 events. • The second (s) is the SI unit used to measure time. • Clocks and watches are used to measure time. Some clocks are more accurate than others. • Figure 9 • Assess your Understanding
Math in Science Accuracy and Precision In a dart game, accurate throws land close to the bull’s-eye. Precise throws land close together. Are these darts thrown accurately or precisely?
Math in Science American Crocodile Egg Data You can use math to analyze the data in the table about the number of American crocodile eggs in seven nests. Calculate the mean, median, mode and range of the crocodile egg data.
Math in Science American Crocodile Nest Data Researchers have been tracking the number of crocodile nests in the Everglades for years. The table shows approximate nest data from 1996 to 2000. What variable could have affected the number of nests?
Graphs Going Wireless How has cell phone use in the United States grown over the years? Take a look at the numbers in the chart.
Graphs Analyzing Line Graphs The line graph shows the results of an experiment that tested the amount of sugar that could dissolve in water as temperature was increased. What happens to the amount of sugar that can be dissolved in water when the temperature decreases?
Graphs Trends and Predictions These graphs are fit from data. We can use these graphs to make predictions or identify trends.
Graphs U.S. Cell Phone Subscribers Use the data in the table to describe a line graph.
Doing Experiments Developing a Hypothesis What are the two hypotheses that might answer this question: Why does it take the school bus longer to get to school on a Monday compared to a Friday?
Doing Experiments Data Tables A data table helps you organize the information collected in an experiment. Graphing the data may reveal whether there are patterns to your data. Do the data support the hypothesis that hummngbirds prefer red feeders?
Doing Experiments Drawing Conclusions Sometimes the same experiment can produce very different data. If the data in this table were yours, what might you do next?