Download
1 / 31
320 likes | 529 Vues
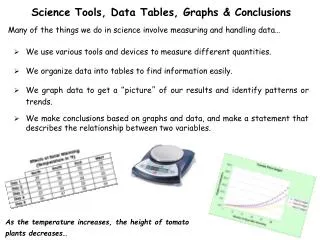
Science Skills Tables and Graphs. Instructor Lois Valli Course SNC1D. Why Use Tables?. Easy to see patterns and relationships Easier/faster to find facts in a table than in prose.

E N D
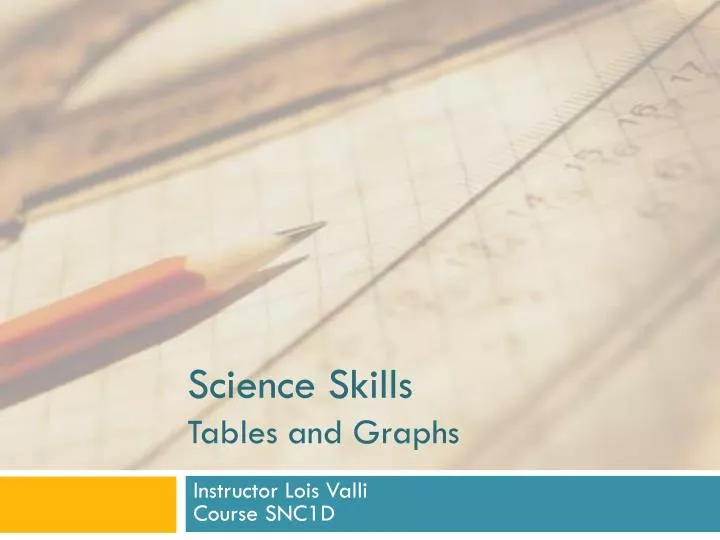
Science SkillsTables and Graphs Instructor Lois ValliCourse SNC1D
Why Use Tables? • Easy to see patterns and relationships • Easier/faster to find facts in a table than in prose The diameter of Mercury is 4879 km while the diameter of earth is 12, 104 km and that of mars is 6792. The density of the moon is 3340 kg/m3 and it’s gravity is 1.6 m/s2. The mass of mars is 0.642 x1024 kg while the mass of the earth is 5.97 x1024 kg .
Organizing Tables • Tables are numbered in the order they appear in the experimental write up • The title tells you what the table is about • Tables are divided into columns and rows • The rows and columns have headings (units)
Using Tables Table 1. World Population Data Source: United Nations, Department of Economic and Social Affairs, Population Division (2011). World Population 2010 (Wall Chart). ST/ESA/SER.A/307. http://esa.un.org/unpd/wpp/Other-Information/wall-chart.htm
Graphs Source: United Nations, Department of Economic and Social Affairs, Population Division (2011). World Population 2010 (Wall Chart). ST/ESA/SER.A/307. http://esa.un.org/unpd/wpp/Documentation/pdf/WPP2010_Wallchart_Plots.pdf
Graphing in Science-Line Graphs • Draw axes • Indent 3 spaces for the axis • Independent variable on horizontal axis (x-axis) • dependent variable on vertical axis (y-axis) • Label both axes and include units (i.e., cm, days, hours, kg)
Graphing in Science-Line Graphs • Choose your scale • Fit all points on the page • Fill at least ½ of your page • Scale should be linear • Scale is easy to use • Do not need to number every square
Graphing in Science-Line Graphs Cont’d 3. Plot your points- make a dot where independent and dependent variables meet and draw a circle around it
Graphing in Science-Line Graphs Cont’d 4. Draw a line of best fit • Curved or straight line passing through most points
Graphing in Science-Line Graphs Cont’d 5. Add title, your name and the date
Grade on Quiz (percent) Time spent studying chemistry (hours)
100 80 60 Grade on Quiz (percent) 40 20 2 4 6 8 10 Time spent studying chemistry (hours)
100 80 60 Grade on Quiz (percent) 40 20 2 4 6 8 10 Time spent studying chemistry (hours)
100 80 60 Grade on Quiz (percent) 40 20 2 4 6 8 10 Time spent studying chemistry (hours)
Eilove Sighence Quiz Grade versus Study Time Name: Eilove Sighence Date: Feb 14, 2012 100 80 60 Grade on Quiz (percent) 40 20 2 4 6 8 10 Time spent studying chemistry (hours)
What type of line? Trajectory of a Red Smarty Time (s)
What type of line? Trajectory of a Red Smarty WRONG! Time (s)
What type of line? Trajectory of a Red Smarty WRONG! Time (s)
What type of line? Trajectory of a Red Smarty Time (s)
What type of line- Curved line Trajectory of a Red Smarty Time (s)
Extrapolation: Trajectory of a Red Smarty Time (s)
What type of line? Melting rate of Ice Tower (cm/hr) Time (hr)
What type of line? Melting rate of Ice Tower (cm/hr) WRONG Time (hr)
What type of line- Melting rate of Ice Tower (cm/hr) Time (hr)
What type of line- Straight line of best fit Melting rate of Ice Tower (cm/hr) Time (hr)
What would you do if your graph looked like this? Melting rate of Ice Tower (cm/hr) Time (hr)
What type of line? Melting rate of Ice Tower (cm/hr) Time (hr)
What type of line? Melting rate of Ice Tower (cm/hr) WRONG Time (hr)
What type of line- 2 curves Melting rate of Ice Tower (cm/hr) Time (hr)
The scientist observes the dependent variable to see how it responds to changes in the independent variable. The new value of the dependent variable is caused by and depends on the value of the independent variable Review Quantitative Deals with numbers. Data can be measured. Length, height, area, volume, weight, speed, time, temperature, humidity, etc. Quantitative → Quantity It is often required to interpolate (i.e. estimate) new points between known points Qualitative Deals with descriptions. Data can be observed but not measured. Colors, textures, smells, tastes, appearance, beauty, etc. Qualitative → Quality Extrapolate:to estimate a value of a dependent variable outside a known range by assuming that the estimated value follows logically from the known values Controlled variables are quantities that a scientist wants to remain constant The independent variableis the one changed by the scientist. As the scientist changes the independent variable, he or she observes what happens. Variable Quantitative Qualitative Controlled variable Independent variable dependent variable Interpolate Extrapolate A variable is any factor, trait, or condition that can exist in differing amounts or types.