Download
1 / 11
120 likes | 498 Vues
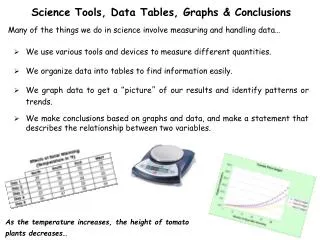
Graphs in Science. The Importance of Graphs Using Graphs to Identify Trends. Graphs. A “picture” for your data. Graphs can reveal patterns or trends that words cannot. Line Graphs.

E N D
Graphs in Science The Importance of Graphs Using Graphs to Identify Trends
Graphs • A “picture” for your data. • Graphs can reveal patterns or trends that words cannot.
Line Graphs • Used to display data to show how one variable (responding) changes in response to another variable (manipulated)
Parts of a Line Graph • Title: Explains what the graphs shows. • Horizontal Axis: Shows the manipulated variable. • Vertical Axis: Shows the responding variable. • Axis Label: Tells what the axis shows.
Parts of a Line Graphs • Data Points: Shows the location of a piece of data (coordinate: pair of numbers used to determine position of a point) • Line: Connects the data points. Shows the trend of the data.
Line of Best Fit • A line of best fit emphasizes the overall trend shown by all data taken as a whole. • Drawing a line of best fit is the proper way to identify the overall trend in data.
Using Graphs to Identify Trends • Nonlinear Graphs: Line graph in which data points do not fall along a straight line. • Line graphs are powerful tools in science because they allow you to identify trends and make predictions.
Linear Trends • Linear graphs easily show how two variables are related.
Nonlinear Trends • In nonlinear graphs, data points may fall along a curve.
No Trend • In other nonlinear graphs, data points may be scattered about no recognizable pattern.
Classwork • Ch1/Sec3 Assessment page 23 • 1a)b)c) 2a)b) 3a)b) • Key Terms definition • Projector Worksheet • Remember you HAVE to copy the whole question!