Download
1 / 1
10 likes | 119 Vues
By: Christina Lavery & Alyssa Perez. The Effect of Water Quality on Levels of Eutrophication. CONCLUSION

E N D
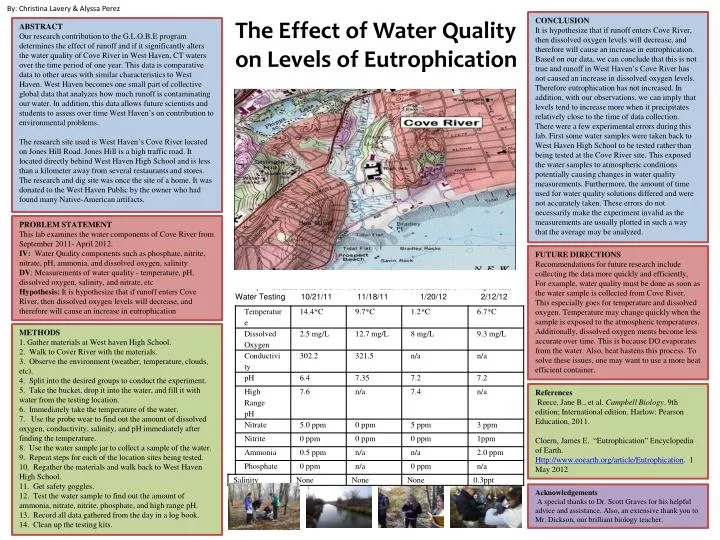
By: Christina Lavery & Alyssa Perez The Effect of Water Quality on Levels of Eutrophication CONCLUSION It is hypothesize that if runoff enters Cove River, then dissolved oxygen levels will decrease, and therefore will cause an increase in eutrophication. Based on our data, we can conclude that this is not true and runoff in West Haven’s Cove River has not caused an increase in dissolved oxygen levels. Therefore eutrophication has not increased. In addition, with our observations, we can imply that levels tend to increase more when it precipitates relatively close to the time of data collection. There were a few experimental errors during this lab. First some water samples were taken back to West Haven High School to be tested rather than being tested at the Cove River site. This exposed the water samples to atmospheric conditions potentially causing changes in water quality measurements. Furthermore, the amount of time used for water quality solutions differed and were not accurately taken. These errors do not necessarily make the experiment invalid as the measurements are usually plotted in such a way that the average may be analyzed. ABSTRACT Our research contribution to the G.L.O.B.E program determines the effect of runoff and if it significantly alters the water quality of Cove River in West Haven, CT waters over the time period of one year. This data is comparative data to other areas with similar characteristics to West Haven. West Haven becomes one small part of collective global data that analyzes how much runoff is contaminating our water. In addition, this data allows future scientists and students to assess over time West Haven’s on contribution to environmental problems. The research site used is West Haven’s Cove River located on Jones Hill Road. Jones Hill is a high traffic road. It located directly behind West Haven High School and is less than a kilometer away from several restaurants and stores. The research and dig site was once the site of a home. It was donated to the West Haven Public by the owner who had found many Native-American artifacts. PROBLEM STATEMENT This lab examines the water components of Cove River from September 2011- April 2012. IV: Water Quality components such as phosphate, nitrite, nitrate, pH, ammonia, and dissolved oxygen, salinity DV: Measurements of water quality - temperature, pH, dissolved oxygen, salinity, and nitrate, etc Hypothesis: It is hypothesize that if runoff enters Cove River, then dissolved oxygen levels will decrease, and therefore will cause an increase in eutrophication FUTURE DIRECTIONS Recommendations for future research include collecting the data more quickly and efficiently, For example, water quality must be done as soon as the water sample is collected from Cove River. This especially goes for temperature and dissolved oxygen. Temperature may change quickly when the sample is exposed to the atmospheric temperatures. Additionally, dissolved oxygen ments become less accurate over time. This is because DO evaporates from the water. Also, heat hastens this process. To solve these issues, one may want to use a more heat efficient container. • Water Testing 10/21/11 11/18/11 1/20/12 2/12/12 • METHODS • 1. Gather materials at West haven High School. • 2. Walk to Cover River with the materials. • 3. Observe the environment (weather, temperature, clouds, etc). • 4. Split into the desired groups to conduct the experiment. • 5. Take the bucket, drop it into the water, and fill it with water from the testing location. • 6. Immediately take the temperature of the water. • 7. Use the probe wear to find out the amount of dissolved oxygen, conductivity, salinity, and pH immediately after finding the temperature. • 8. Use the water sample jar to collect a sample of the water. • 9. Repeat steps for each of the location sites being tested. • 10. Regather the materials and walk back to West Haven High School. • 11. Get safety goggles. • 12. Test the water sample to find out the amount of ammonia, nitrate, nitrite, phosphate, and high range pH. • 13. Record all data gathered from the day in a log book. • 14. Clean up the testing kits. • References • Reece, Jane B., et al. Campbell Biology. 9th edition; International edition. Harlow: Pearson Education, 2011. • Cloern, James E. “Eutrophication” Encyclopedia of Earth. Http://www.eoearth.org/article/Eutrophication. 1 May 2012 Acknowledgements A special thanks to Dr. Scott Graves for his helpful advice and assistance. Also, an extensive thank you to Mr. Dickson, our brilliant biology teacher.