Download

1 / 6
60 likes | 401 Vues
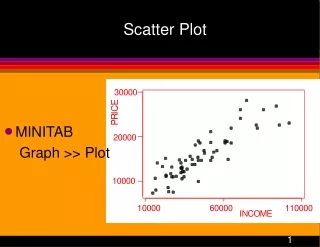
Scatter Plot. What are we Learning About Today?. How to construct scatter plots How to interrupt scatter plots. Why are these Plots called scatter Plots?. Ummm ….. cuz they are Scattered!!!! The points are all over the place!!. How do we use Scatter Plots?.

E N D
What are we Learning About Today? • How to construct scatter plots • How to interrupt scatter plots
Why are these Plots called scatter Plots? • Ummm…..cuz they are Scattered!!!! • The points are all over the place!!
How do we use Scatter Plots? • To easily and quickly look at and interrupt data.
Vocab.... • Scatter Plot • Example……………… • Is a graph that shows the relationship between two sets of data. • The years (1990- 2009) and Angel wins.
How do you interpret a Scatter Plot’s Data • Positive Relationship • Negative Relationship • No Relationship • As x increases, y increases. Climbing up the hill!! • As x increases, y decreases. Going down the hill!! • No obvious pattern…CHAOS!!!