Download
1 / 30
300 likes | 419 Vues
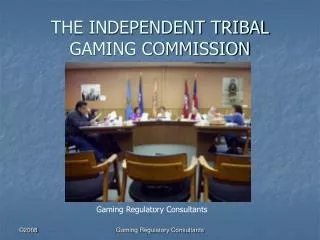
Gaming Commission Update 12-1-09. Board of Directors Donna Sytek, Chair John B. Andrews John D. Crosier, Sr. William H. Dunlap Sheila T. Francoeur Chuck Morse Todd I. Selig Stuart V. Smith, Jr. Brian F. Walsh Kimon S. Zachos Martin L. Gross, Chair Emeritus Staff

E N D
Gaming Commission Update12-1-09 Board of Directors Donna Sytek, Chair John B. Andrews John D. Crosier, Sr. William H. Dunlap Sheila T. Francoeur Chuck Morse Todd I. Selig Stuart V. Smith, Jr. Brian F. Walsh Kimon S. Zachos Martin L. Gross, Chair Emeritus Staff Steve Norton, Executive Director Ryan Tappin Cathy Arredondo “…to raise new ideas and improve policy debates through quality information and analysis on issues shaping New Hampshire’s future.”
Positive Revenue to State: License Fees Revenue to State: Tax on Gambling Revenue to State: BPT and BET Revenue to State: Increase in Meals and Rooms Revenue to Local: Property Tax Economic Development Local: Construction Job Economic Development: New Jobs Negatives Revenue to State: Decrease in Meals and Rooms (cannibalization) Revenue to State: Gambling/ Lottery Substitution State Expenditures: New Regulatory structures State Expenditures: Competition for funds Economic Development: Branding Economic Development: Cannibalization Gov Expenditures: Policing Social Costs: New Crime Social Costs: Pathological/ Problem Gaming Prudent Calculations: Cost-Benefit
Gaming as a Field of Study • Focus on gaming has intensified during the 90s a ‘young’ literature. • Attempt to find peer reviewed work in journals with no specific ties to pro- or anti-gaming interests. • In the end, will have to rely on triangulation method, using multiple sources, not always peer reviewed.
National Data Gallup (2007) – 66% of the population ‘gambled’ in some fashion in the last 12 months. Lottery Ticket: 46% Visited Casino: 24% ESRI Data Gambled at a Casino: 17% Propensity to gamble seems to have declined over the past 4 years. New Hampshire New Hampshire (Barrow) Any in last 12 months: 56% Lottery Ticket: 42% Casino: 21% ESRI Data Gambled at a Casino in last 12 months: 17.3% Propensity to Gamble
Slots Female (61% of all) 50 to 59 (21% of all); 21 to 29 (20% of all); 40 to 49 (16% of all) Some high-school education (35%) $75,000 to $150,000 (29%); $45,000 to $75,000 (28%). Table Games Males (85%) 21 to 29 (28%); 30 to 39 (24%) Bachelors + (43%) $75,000 to $150,000 (39%); $45,000 to $75,000 (20%) Who’s Gambling? Clyde Barrow: “Playing the Odds II”
Average Visits to ‘Local’ Casinos • Massachusetts • 1,133,564 visitors to Foxwoods (3.3 visits per year) • 850,173 visitors to Mohegan Sun (2.7 visits per year) • New Hampshire • 95,667 people to Foxwoods (1.7 visits per year) • 105,233 people to Mohegan Sun (2.0 visits per year) Barrow: Playing the Odds II
NH Residents gambling outside of NH • In 2007, estimates suggested that New Hampshire residents spent $79.3 million at New England’s Gambling facilities, indirectly paying $11.3 million in Gambling and sales taxes to CT, RI and ME (source: UMASS/Dartmouth 9/16/2008) • $46 million at Foxwoods • $30 million at Mohegan Sun • $2.5 million at Twin River (RI) • $0.2 million at Newport Grand (RI) • $0.8 million at Hollywood (ME) • Does not include Gambling outside of New England (Atlantic City, Las Vegas)
Legal Wagering by New Hampshire Residents Estimate NE Casinos data based on analysis by Barrow (University of Massachusetts Dartmouth) Remainder from Lottery, Pari-Mutuel Commissions
Estimate of Existing Problem Gaming • Pathological, Problem, At-Risk primary vehicle through which social ills occur. • NORC (2000) • National estimate • Pathological: 1.2% • Problem:1.5% • At-Risk 7.7% • Schaeffer and Hall (2001) • National estimate • Pathological: 1.7% • Problem: 3.7% • Barrow (New England, 2007) • Pathological: 0.6% • Problem: 1.0% • At-Risk: 6.1%
Revenues to State • NH Lottery • $75 million ($261 wagered -$186 in prizes and expenses) was distributed to education trust fund in FY2008. • NH Lottery Revenue declined by 1.1% from 2007 to 2008. • Charitable Gaming/Racing after expenses collected. • State: Simulcast wagering - $2.1m; Live Racing - $0.2m; Bingo - $1.3m; Games of Chance – $0.6m • New Hampshire charities received over $11.6 million dollars (including Bingo and Lucky 7) to further their causes in 2008 from all charitable gaming. • Gambling Tax (2009) - The Gambling Winnings tax is estimated to yield $5.9 million in FY2010, $7.9 million in FY2011 (from HB1)
Future Revenues • Industry methods for generating revenue estimates are sophisticated. • Recent declines reflect market saturation or economic decline? • New vs. Old gambling: NH’s ability to cannibalize existing gambling in Mass, etc… • What’s the market? • Varies depending on the type of facility • How nice is the facility Capital investment • Casino vs. Racino Casino’s have a broader draw • A function of action of other players (Massachusetts) • Implications of possible change in federal law regarding internet • Impact of ‘Less Aggressive Machines’ • Impact on Meals and Rooms (cannibalization)
Total population in circle is 2.6 million. • Total NH population in circle is 678,000. (about half state’s total population). • ~26% of total population in circle is NH residents.
Drive Times for Berlin, NH Lincoln, RI
Social Costs • Crime • Grinols and Mustards is the gold-standard though not without methodological issues as noted by Walker. • Triangulate? • Grinols and Mustards (8% increase) • Edmonton study (4% increase) • Social Costs • What is a social cost and who bears the burden of that social cost (family, economy, community, government) • Pathological gaming increase occurs • Geographically isolated • Who bears the burden? • Massachusetts and New Hampshire (and VT and Maine)
Economic Development • How big? • Hosp? • Manufacturing? • Gaming ? • Short term • Simulations a function of initial capital investment • $130 m fewer jobs • $250 m more jobs • Long term • More jobs • 75% not high paying • Cannibalization of other (retail) activities • Direct competition (e.g. new restaurant) • Indirect competition (e.g. competing for each discretionary dollar)
NH’s Brand • More information needed. • What effect would a 5% increase in crime have on the quality of life in NH? • Move us from #1 to #2? Or from #1 to #10? • Is it possible to have Casinos without losing NH’s brand?
Regulatory Environment • Local Referendums: (only town or surrounding towns)? • Existing Regulation • What rules are there about restriction on political contributions? • Lottery Commission • Pari-Mutuel Gaming Commission • New Structures • State owned • Is the existing regulatory structure sufficient • Regulation of slot machines • ‘Less Aggressive’ machines • Controlling Proliferation
Critical Variables • Economic activity, discretionary spending and consumer confidence. • Decisions made by Massachusetts and Maine • Phasing • Do we really have sufficient information to estimate cost/benefit?