Download
1 / 14
150 likes | 302 Vues
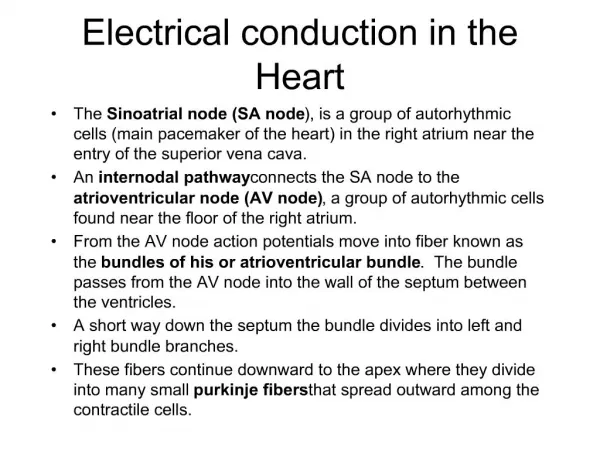
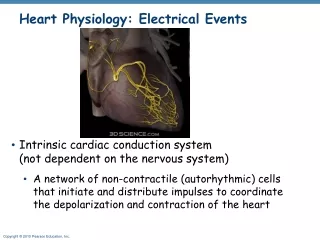
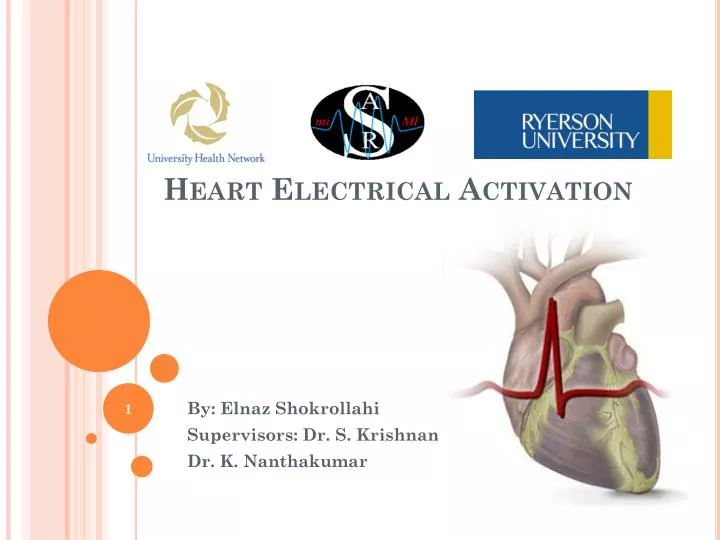
Heart Electrical Activation. By: Elnaz Shokrollahi Supervisors: Dr. S. Krishnan Dr. K. Nanthakumar. Signal Propagation in Heart. Stimulus originates in the SA node and travels across the walls of the atria, causing them to contract.

E N D
Heart Electrical Activation By: ElnazShokrollahi Supervisors: Dr. S. Krishnan Dr. K. Nanthakumar
Signal Propagation in Heart • Stimulus originates in the SA node and travels across the walls of the atria, causing them to contract. • Stimulus arrives at the AV node and travels along the AV bundle • Stimulus descends to the apex of the heart through the bundle branches • After stimulus reaches the Purkinje fibers, the ventricles contract.
Tachycardia (Fast Heartbeat) Bradycardia (Slow Heartbeat) Cardiac Arrhythmia • Cardiac arrhythmia is when the electrical activity of the heart is irregular (faster/slower) than normal. Ventricular Fibrillation
Conventional EP Mapping • Point-by-point mapping acquisition. • Direct voltage mapping. • Many Disadvantages: • Identification of areas of low voltage is time-consuming catheter manipulation. • Focal lesion creation may not be sufficient to ablate VT conduction through a broad isthmus region. • Identification breakthrough points may be challenging.
Non-contact Mapping • Catheter of its own. • Non-contact mapping uses unipolar Virtual Electrograms (VE)
Electrogram • Recording of cardiac potentials • from electrodes directly in contact • with the heart.
Time-Domain Analysis • -Peak Negative Voltage (PNV) in (mV) • -Maximal Negative dV/dt (mV/ms) • -Area Under the Curve (AUC) • -Presence of an initial R-wave • -Duration • -Presence of low-amplitude depolarization
Frequency- Domain Analysis • FFT requires large quantities of data to produce significant result. • AR modeling
Results of Classification Results with AR Coefficients
Conclusions • Presented electrographic parameters. • Morphologies of electrograms allowed the discrimination of endo/epicardially paced activation. • Possibility of combination of the criteria will improve the perception over any single criterion. • Allow to detect tachycardia originating epicardially using noncontact mapping.
Brain Storming Thank you for your attention!