Download
1 / 11
270 likes | 760 Vues
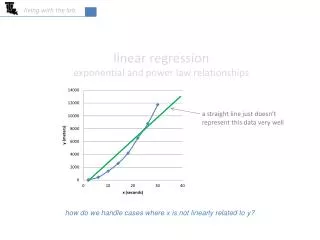
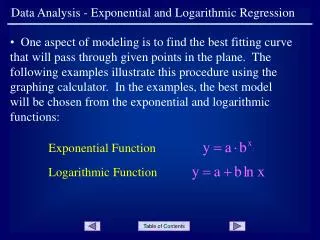
Exponential Regression. Copy the table below your notebook and then graph the points. Find an exponential function to fit the data. etc. Exponential Regression. T he relation between values of x and values of y, from which the value of y can be predicted for any value of x.

E N D
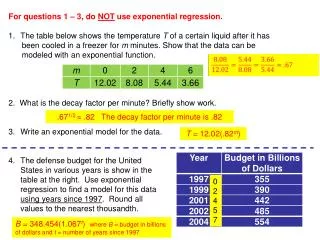
Copy the table below your notebook and then graph the points
Exponential Regression • The relation between values of xand values of y, from which the value of y can be predicted for any value of x.
CLEAR! ENTER!
Step 1. Enter the data in the calculator lists. Place the data in L1 and L2. STAT, #1Edit, type values into the lists
Step 2. Prepare a scatter plot of the data. Set up for the scatterplot. 2ndStatPlot- the first icon ChooseZOOM #9 ZoomStat.
Step 3. Have the calculator determine the line of best fit.STAT → CALC #4 LinReg(ax+b) Include the parameters L1, L2, Y1. (Y1 comes from VARS → YVARS, #Function, Y1)
Step 4. Graph the line of best fit. To get a predicted value within the window, hit TRACE, up arrow, and type the desired value.