Download
1 / 24
260 likes | 523 Vues
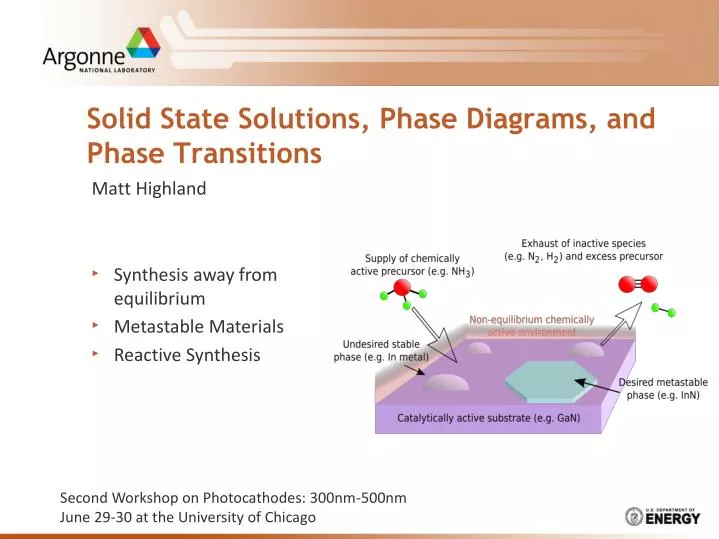
Solid State Solutions, Phase Diagrams, and Phase Transitions. Synthesis away from equilibrium Metastable Materials Reactive Synthesis. Matt Highland. Second Workshop on Photocathodes: 300nm-500nm June 29-30 at the University of Chicago.

E N D
Solid State Solutions, Phase Diagrams, and Phase Transitions • Synthesis away from equilibrium • Metastable Materials • Reactive Synthesis • Matt Highland Second Workshop on Photocathodes: 300nm-500nm June 29-30 at the University of Chicago
Typical thermodynamics gives us guide posts on synthesis near equilibrium • Engineering materials with specific properties often requires synthesis away from equilibrium • “Metastable” materials that demand non-equilibrium and kinetically controlled synthesis path ways • Metastable synthesis requires additional stabilization during growth: Synthesis away from Equilibrium StrainEpitaxy Energetic ionsSputtering Chemical ActivityReactive Synthesis SrRuO3 and Co3O4
Reactive Synthesis of Metastable Materials • Reactive synthesis utilizes activity of chemical precursors to stabilize desired phases • Practical example: (In,Ga)N solid solutions • Band-gap tunable across solar spectrum by varying solid solution content LEDs for solid state lighting
InGaN: The promise and truth • The promise • Solid-state lighting has the potential reduce U.S. energy consumption from 3.1 to 2.1 petawatt-hours/year* • Roughly the output of 250 coal fired power plants • The truth • External quantum efficiency drops as InN content increases • Driven by problems with crystal quality and the metastable nature of InN High-power (>1 Watt input) visible-spectrum LEDs (AlxGa1-x)0.52In0.48P InxGa1-xN V(l) V(l) External quantum efficiency, hext Tj = 25C *“Energy Savings Potential of Solid State Lighting in General Illumination Applications”, http://www.netl.doe.gov/ssl Peak wavelength, lp (nm)
The Fundamental Problem • At desirable growth temperatures required nitrogen activity is equivalent to kilobars (~104 psi) of N2 • During MOCVD growth nitrogen activity provided by cracking ammonia • Reaction we want to avoid: Ambacher et al., JVST B 14, 3532 (1996) 5
Intermediate Chemical Species • We know the overall reaction desired for growth • However what are the intermediate chemical species that drive this growth ? • All we know is the precursors crack somehow interact 6
Attacking a Problem on Multiply Fronts • We’re employing multiply in-situ probes and computational techniques to understand the details of reactive synthesis In-situ IR spectroscopy In-situ X-ray Analysis Theory & modeling 7
Probing the Growth Environment Fluorescence Detector • Synchrotron x-rays are capable to penetrating the MOCVD environment and yield structural and elemental details in real time • In-situ MOCVD reactor at sector 12ID-D of the Advanced Photon Source • Diffraction from GaN surfaces and InN crystals • X-ray Fluorescence from deposited Indium • Measurements reveal a very complex growth behavior Movie camera Visible illumination Synchrotron x-rays Scattering Detector 8 8
In-InN Phase Boundaries In liquid droplets Bare GaN surface pNH3= 27 Torr InN crystals • By monitoring InN and In liquid formation we can map out an indium condensation phase diagram • Upon increasing TMI flow • At higher temp, elemental In liquid condenses • At lower T, relaxed InN solid particles grow F. Jiang, et al. PRL 101, 086102 (2008)
Oscillatory Growth and Decomposition Epitaxial InN islands Elemental In droplets • Near phase boundaries system can spontaneously oscillate • Inter-conversion between InN and liquid In • AFM of quenched samples shows microstructure of distinct surface species F. Jiang, et al. PRL 101, 086102 (2008)
Chemical Wave Patterns • Spatial variation between InN and In can be resolved optically • Dark regions: InN • White regions: In liquid • Waves of InN or In liquid • Sweep across the sample • Form concentric rings • Spiral patterns F. Jiang, et al. PRL 101, 086102 (2008) 11
What Drives the Oscillatory Behavior ? • The key to this complex growth behavior is local nitrogen activity • NH3 impinges on the hot sample surface, cracks and forms some highly active chemical species (NHx) • These active species either interact with In and form InN or react to eventually form N2 and leave the surface. • The efficiency with which NH3 is cracked and the residence time of the intermediate species determines which material grows 12
Oscillatory Growth Mechanism Critical amount of liquid In metal condenses which accelerates conversion of NH3to N2 and InN starts to decompose NH3 cracks on the GaN of InN surface and forms the intermediate species that allow InN to grow Liquid In metal evaporates to expose GaN surface and InN growth starts again
Intermediate Chemical Species • The local intermediate chemical species dictate growth behavior • Different surfaces catalytically crack NH3 differently and possibly change residence time of intermediate species • If we can understand which intermediate species enable InN growth, then we can better stabilize and encourage its formation • What are the intermediate nitrogen species? • First principle calculations • Additional in-situ probes 14
First-principle Calculations fixed • (2x2) surface unit cell • - 4 H3 “hollow” sites • - 4 T1 “on top” Ga sites • 4 T4 “on top” N sites • 12 br “bridge” site • We can calculate the lowest energy configurations of NH3, NH2, NH, N, and H on a GaN and InN surface • We can then create a phase diagram predicting the equilibrium coverage species for given conditions • “We” = Peter Zapol, Weronika Walkosz, and Xin Tan
Predicted Phase Diagram Predicted structures on GaN surface • Lowest energy surface species differ depending temperature and nitrogen activity • One of these configuration maybe be what enable InN growth • Can we find these phases experimentally ? N-rich Ga-rich W. Walkosz, et al. PRB 85, 033308 (2012)
Surface and Crystal Truncation Rods • An abrupt crystalline surface in real-space creates an extended rod of scattering in reciprocal space • Scattering that occurs along this Crystal Truncation Rod (CTR) away from the Bragg peaks is very sensitive to surface changes (10L) CTR (00L) CTR 17
Predicted CTRs Predicted structures on GaN surface • First Principle can be used to predict CTRs for each phase • Can we see these changes with in-situ x-rays ? N-rich Ga-rich W. Walkosz, et al. PRB 85, 033308 (2012)
Experimentally measured CTRs • With different amounts of NH3, N2, and H2 in the sample environment we see large changes at anti-Bragg conditions • Modeling shows that CTR changes are consistent with a number of predicted surface structures • Uniqueness problem: Modeling generates a number of structures that fit equally well. Surface studies of GaN at 450°C as a function of chemical environment 20L Rod 19
In-situ Surface Chemistry • How can we get information about the intermediate chemical species on the surface ? • X-rays are great at looking at the In phases (the heavy stuff), but how about highly reactive surface species (the light stuff)? • Photons of a different length: in-situ Reflection-Absorption IR Spectroscopy (RAIRS) • Can distinguish between NH3, NH2, and NH • Can penetrate MOCVD environment X-ray beam
RAIRS: Challenges to Overcome • Heater is IR Source • Solution: Bandpass filtering to mask black body radiation • Surface vs. Gas species • Solution: Polarize emitted spectrum • Gas species are isotropic • Surface species show polarization dependence • Metallic Surface: • Solution: ZrN • 10% lattice mismatch to InN • 0.6% lattice mismatch to GaN • Stable in MOCVD Environment 01L rod of ZrN 21
Future Plans • By combining Reflection-Absorption IR Spectroscopy with grazing incidence surface x-ray scattering we correlate InN structure, surface chemical species, and theoretical surface structure predictions we will understand what are the intermediate chemical process the allow InN to form and grow In-situ IR spectroscopy In-situ X-ray Analysis Theory & modeling • We hope to use this knowledge to design new synthesis pathways and improve the quality of InN and InGaN alloys 22
Summary • Synthesis of Metastable Materials requires we exploit kinetically limited and non-equilibrium pathways. • We’ve shown that the synthesis of InN with highly reactive chemical species is a complex interplay of surface chemistry and structure • Through a fundamental understanding of these metastable path ways we may be able to push the boundaries of the materials we synthesis and properties we can engineer
Acknowledgment Edith Perret, Materials Science Division, Argonne National Laboratory Weronika Walkosz, Chemical Sciences and Engineering Division, Argonne National Laboratory Xin Tan, Chemical Sciences and Engineering Division, Argonne National Laboratory Kedar Manandhar , Department of Physics, University of Illinois at Chicago Paul Fuoss, Materials Science Division, Argonne National Laboratory Carol Thompson,Department of Physics, Northern Illinois University Peter Zapol,Chemical Sciences and Engineering Division, Argonne National Laboratory Stephen Streiffer, Physical Sciences & Engineering, Argonne National Laboratory Mike Trenary, Department of Physics, University of Illinois at Chicago Brian Stephenson, Advanced Photon Source, Argonne National Laboratory Work supported by the U.S. Department of Energy, Office of Science, Office of Basic Energy Sciences, under contract No. DE-AC02-06CH11357 24