Download
1 / 11
200 likes | 701 Vues
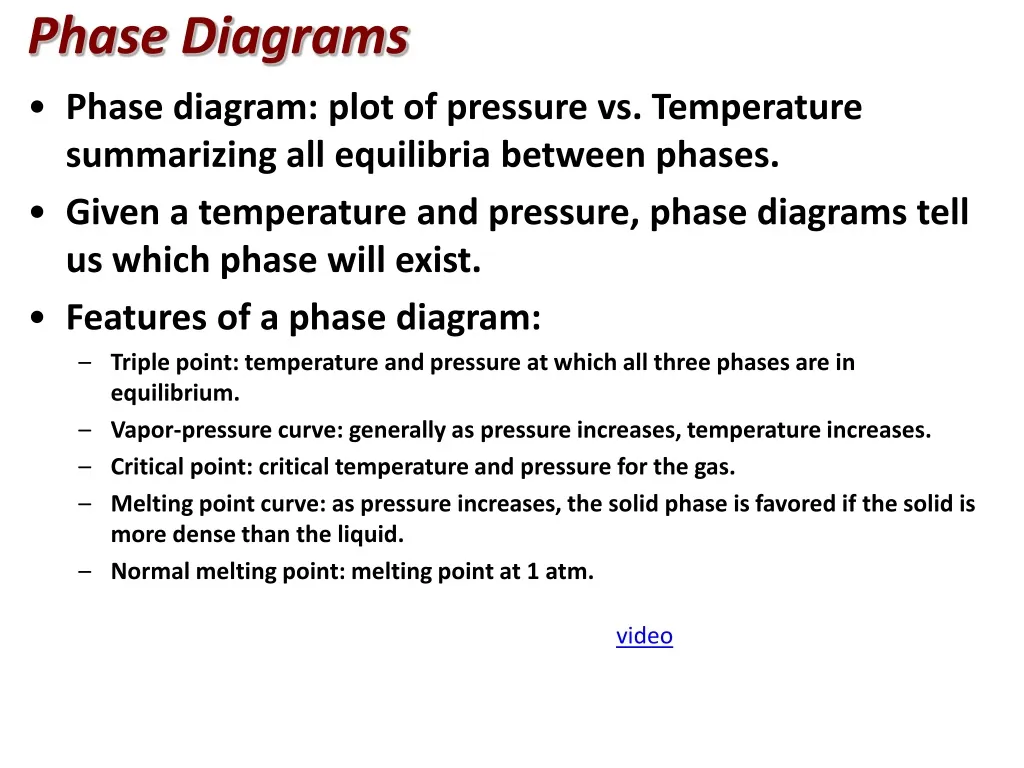
Phase Diagrams. Phase diagram: plot of pressure vs. Temperature summarizing all equilibria between phases. Given a temperature and pressure, phase diagrams tell us which phase will exist. Features of a phase diagram:

E N D
Phase Diagrams • Phase diagram: plot of pressure vs. Temperature summarizing all equilibria between phases. • Given a temperature and pressure, phase diagrams tell us which phase will exist. • Features of a phase diagram: • Triple point: temperature and pressure at which all three phases are in equilibrium. • Vapor-pressure curve: generally as pressure increases, temperature increases. • Critical point: critical temperature and pressure for the gas. • Melting point curve: as pressure increases, the solid phase is favored if the solid is more dense than the liquid. • Normal melting point: melting point at 1 atm. video
Phase Diagrams • Any temperature and pressure combination not on a curve represents a single phase.
Phase Diagrams • The Phase Diagrams of H2O and CO2 • Water: • The melting point curve slopes to the left because ice is less dense than water. • Triple point occurs at 0.0098C and 4.58 mmHg. • Normal melting (freezing) point is 0C. • Normal boiling point is 100C. • Critical point is 374C and 218 atm. • Carbon Dioxide: • Triple point occurs at -56.4C and 5.11 atm. • Normal sublimation point is -78.5C. (At 1 atm CO2 sublimes it does not melt.) • Critical point occurs at 31.1C and 73 atm.
Phase Diagrams The Phase Diagrams of H2O and CO2
Critical Point: indicates the critical temperature and critical pressure • Critical Temperature: temperature above which the substance cannot exist in the liquid state • Critical Pressure: lowest pressure at which the substance can exist as a liquid at the critical temperature
At the critical point C, the properties of the gas and liquid phases approach one another, resulting in only one phase: a homogeneous supercritical fluid It can diffuse through solids like a gas, and dissolve materials like a liquid
Supercritical CO2 Used to Decaffeinate Coffee is any substance at a temperature and pressure above its critical point Chapter 11
Applications • Decaffeinating coffee • Solvents for dry-cleaning • Refrigeration • Biodiesel production
Application • Freeze drying food: freeze food and then lower pressure so ice sublimes