Download

1 / 12
140 likes | 726 Vues
Phase Diagrams. Show the ranges of temperatures (and/or P) and composition over which phases or mixtures of phases of a compound or compounds are stable. Can also show existence of allotropes or polymorphism (solids having same composition, but different structure).

E N D
Phase Diagrams • Show the ranges of temperatures (and/or P) and composition over which phases or mixtures of phases of a compound or compounds are stable. • Can also show existence of allotropes or polymorphism (solids having same composition, but different structure). • Each phase occupies an area of the diagram.
Phase Diagrams • Phase Rule: P + F = C + 2 • P = # of phases present in equilibrium. • C = # of components needed to describe system. • F = degrees of freedom = # of independent variables that can be varied without changing the # or composition of the existing phases. • e.g. to right is 1 component (H2O) phase diagram. P + F = 1 + 2 = 3 • A – at that point one phase (gas), so 2 degrees of freedom; can change T or P. • B – at interface of liquid and vapor there are two phases, so 1 degree of freedom; if change T, must also change P. • C – triple point, so no degrees of freedom; changing either T or P changes composition. • D – critical point; δ(vapor) = δ (liquid). • D • B • A • C
Phase Diagrams • First-order phase transition. • Move from liquid to vapor; temperature will stop changing at this point until all of the liquid becomes vapor and only then will continue to increase.
Binary Phase Diagram • Phase diagram for two similar components; aka “Solid Solution”. • Assume Pressure = 1 atm, so 2D rather than 3D plot. • Two components, so F + P = 2 + 2 = 4 • Composition = mole fraction; 100% B to 100% A. • Tm(B) = melting point of pure B. • Tm(A) = melting point of pure A. • Liquidous = boundary between liquid and mixed phase; gives liquid composition. • Solidous = boundary between solid and mixed phase; gives solid composition. Tm(B) Tm(A)
Binary Phase Diagram • Heat mixture of A & B (at mole fraction indicated) to temperature 1. Then cool. • At temperature 1, liquid phase has composition = mole fraction. • At temperature 2, solid begins to ppt out; solid is mostly B mixed crystal (composition b1). • At temperature 3, solid has composition b2 and liquid has composition a’2; note different mole fractions! • at a given temperature, the liquid and solid that are in equilibrium with each other have different compositions. • At temperature 4, solid formed has composition = b3 = original mole fractions. 1 2 3 4
Binary Phase Diagram • Note that on cooling, the solid will change composition from almost pure B to more and more A composition. • Coring: freeze in tube from outside; core will have different composition. • Heat & Beat: heat above liquidous, cool below solidous (but not too far), then beat (to make deformities), then reheat almost to solidous (increase diffusion), beat and repeat. Like? Blacksmith. liquidous solidous B mole fraction A
Binary Phase Diagram • Example of a system involving the formation of mixed crystals with temperature minimum: special point for which the compositions of the solid and liquid are the same. • It is possible to have the special point at a temperature maximum. liquid (1-phase) liquid composition special point solid composition solid (1-phase)
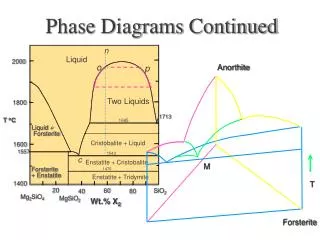
Eutectic Phase Diagram • What if two substances are NOT similar at all? They won’t want to mix in the solid state, but will in the liquid; e.g. NaF & PbF2. Eutectic Point (cusp) -eutectic mixture has lower mp than either of the pure components or any other mixture. Tm(NaF) liquid Tm(PbF2) liquidous curve -highest temp. at which crystals can exist. NaF(s) + liquid PbF2(s) + liquid NaF(s) + PbF2(s) don’t mix solidous curve = Eutectic Temperature -lowest temp. at which liquids can exist. NaF mole fraction PbF2
Eutectic Phase Diagram • Heat above liquidous and cool; first solid is pure NaF; below Eutectic Temperature both solids appear. Tm(NaF) liquid solid is pure NaF Tm(PbF2) liquid has increasing PbF2 fraction NaF(s) + liquid PbF2(s) + liquid NaF(s) + PbF2(s) don’t mix solid PbF2 begins to ppt particles of NaF & PbF2 • • • • • • • • • NaF mole fraction PbF2 pure NaF
Phase Diagrams • Have seen two extremes: solid solution, where the two compounds “like” each other & eutectic mixture, where the two compounds “hate” each other. • What happens as the two compounds get away from these extremes? Solid Solution Eutectic Mixture
Phase Diagram For Two Almost Immiscible Solids region of solubility of A in B region of solubility of A in B always some width e.g. most soldier is 50:50 Pb/Sn; heat to solid/liquid region; get solid particles in slushy soldier liquid
Phase Diagram If Two Components Form 3rd Compound • Looks like two Eutectic Diagrams next to each other. new compound melts congruently Two Eutectic Points Compound Forms; called line compound