Download
1 / 17
170 likes | 206 Vues
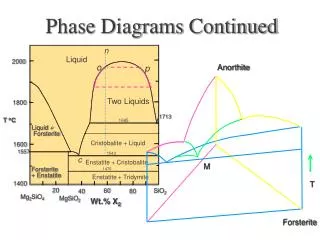
Phase Diagrams. Chapter 11. Chemical Systems. Undergo three main processes that change their energy Chemical reactions Heating/cooling Phase transitions. Phase Diagrams.

E N D
Phase Diagrams Chapter 11
Chemical Systems • Undergo three main processes that change their energy • Chemical reactions • Heating/cooling • Phase transitions
Phase Diagrams Phase diagrams display the state of a substance at various pressures and temperatures and the places where equilibria exist between phases.
Phase Diagrams The AB line is the liquid-vapor interface. It starts at the triple point (A), the point at which all three states are in equilibrium.
Phase Diagrams It ends at the critical point (B); above this critical temperature and critical pressure the liquid and vapor are indistinguishable from each other.
Phase Diagrams Each point along this line is the boiling point of the substance at that pressure. Pressure = Force / area Increasing pressure causes the molecules to be condensed making the molecular arrangement closer
Phase Diagrams The AD line is the interface between liquid and solid. The melting point at each pressure can be found along this line.
Phase Diagrams Below A the substance cannot exist in the liquid state. Along the AC line the solid and gas phases are in equilibrium; the sublimation point at each pressure is along this line.
Phase Diagrams As temperature increases, the average kinetic energy of the substance increases causing the spacing between the molecules to increase and eventually change phase
Phase Diagram of Water Note the high critical temperature and critical pressure: These are due to the strong van der Waals forces between water molecules. London dispersion force Dipole-dipole forces Hydrogen bonding Increase the melting and boiling point of water
Phase Diagram of Water The slope of the solid–liquid line is negative. This means that as the pressure is increased at a temperature just below the melting point, water goes from a solid to a liquid.
Phase Diagram of Carbon Dioxide Carbon dioxide cannot exist in the liquid state at pressures below 5.11 atm; CO2 sublimes at normal pressures.
Phase Diagram of Carbon Dioxide The low critical temperature and critical pressure for CO2 make supercritical CO2 a good solvent for extracting nonpolar substances (such as caffeine).
Intermolecular Forces and impact on ideal behavior • Presence of intermolecular forces among gas particles (including noble gases) leads to deviations from ideal behavior • Therefore, at sufficiently low temperatures or sufficiently high pressures, gases can condense
Heating/Cooling • Between phase changes, all heat (energy) absorbed or released changes the average amount of KE (therefore, the T) of the substance • Areas on graph with a slope
Heating/Cooling • There is no slope in areas where a phase change is occuring • All energy is being used to change the phase of matter (rather than change the temperature)
Heating/Cooling • Melting and Boiling • Endothermic • Freezing and Condensation • Exothermic • The amount of energy needed to vaporize = amount of energy needed to condense • Reverse phase changes have equal but opposite magnitudes of energy gained or released • Same applies for melting and freezing