Download
1 / 20
230 likes | 449 Vues
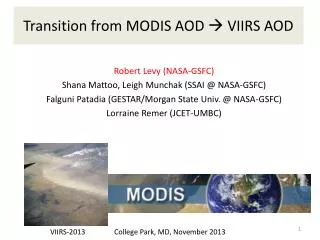
Global Estimates of Ambient PM 2.5 Concentrations from Satellite AOD. Aaron van Donkelaar w ith contributions from: Randall Martin, Brian Boys, Crystal Weagle , and Graydon Snider VIIRS Aerosol Science and Operational Users Workshop November 21-22, 2013.

E N D
Global Estimates of Ambient PM2.5 Concentrations from Satellite AOD Aaron van Donkelaar with contributions from: Randall Martin, Brian Boys, Crystal Weagle, and Graydon Snider VIIRS Aerosol Science and Operational Users Workshop November 21-22, 2013
PM2.5 affects human health and longevity • Life expectancy increases 7 months per 10 μg/m3 decrease in long-term exposure • PM2.5 regulation achieved largest gains of all U.S. Federal Regulation • Dominates global environmental mortality by 2030 Particulate Matter Ground-level Ozone Unsafe Water Supplyand Sanitation Indoor Air Pollution Malaria 2010 2030 2050 0.0 1.0 2.0 3.0 4.0 Deaths (millions of people) OECD, 2012
Vast Regions Have Insufficient Measurements for Air Pollution Exposure Assessment Locations of Publicly Accessible Long-Term PM2.5 Monitoring Sites Emerging Network Monitor locations can be driven by compliance objectives ~1 site / 10,000 km2 in continental US & southern Canada
Previous Global Burden of Disease Report for 2000Impaired by Insufficient Global Observations of Fine Particulate Matter (PM2.5) Estimate air pollution in urban areas causes: • ~1 million deaths (~1%) Could not estimate effects outside of urban areas for 2000 report Could this be improved with satellite remote sensing? Cohen et al., 2005
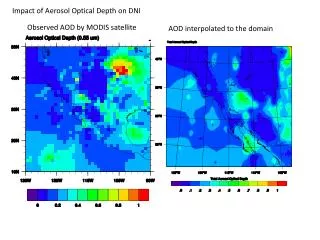
AOD is related to PM2.5…but how to separate surface aerosol from column concentrations? • PM2.5 / AOD ratio is a function of: • vertical structure • aerosol type/hygroscopicity • meteorology Multiple approaches: • surface monitors calibration • empirical relations • model output 20 80 140 PM2.5 / AOD [μg/m3] GEOS-Chem v8-01-04
Significant agreement with coincident ground measurements over NA 18 16 14 12 10 8 6 4 2 0 Annual Mean PM2.5 [μg/m3] (2001-2006) Satellite Derived Satellite-Derived [μg/m3] In-situ In-situ PM2.5 [μg/m3] van Donkelaar et al., EHP, 2010
Satellite-derived PM2.5 shows global agreement Outside Canada/US N = 244 (84 non-EU) r = 0.83 (0.83) Slope = 0.86 (0.91) Bias = 1.15 (-2.64) μg/m3 CTM Agreement: r = 0.63 (0.72) slope = 0.54 (0.60) bias = 8.89 (2.45) μg/m3 0 5 10 15 20 50 80 Satellite-Derived PM2.5 (2001-2006) [μg/m3] van Donkelaar et al., EHP, 2010
Global impact of global data Global Burden of Disease 2010 • 488 authors from 303 institutions in 50 countries • Inclusion of rural populations • PM2.5 causal role in 3 million deaths per year Lim et al., Lancet, 2012 • Inform Epidemiological Studies: • Global childhood asthma (Anderson et al., 2012) • Lung cancer in Canada (Hystad et al., 2012) • Mortality in California (Jerrett et al., 2013) • Diabetes(Brook et al., 2013; Chen et al., 2013) • Global adverse birth outcomes (Fleisher et al., in press) • Hypertension(Chen et al., in press) • Low PM2.5 cardiovascular mortality (Crouse et al., 2012) Crouse et al., EHP, 2012
Global in situ monitors are sparse...and far from AERONET • PM2.5 estimates accuracy impacted by • AOD retrieval • Simulated aerosol vertical profile • Mass to extinction conversion • Sampling (clouds/snow) • Difficult to evaluate error sources • SPARTAN network collocates PM2.5 and AOD measurements • Satellite-derived PM2.5 evaluation, analysis, www.spartan-network.org Airphoton PM2.5 (Vanderlei Martins) Filter PM2.5 Filter PM10 3-λNephelometer AOD from CIMEL Sunphotometer (e.g. AERONET)
CALIOP allows vertical profile correction 5 4 3 2 1 0 GEOS-Chem CALIOP Determine profile accuracy: • Compare with CALIOP space-borne lidar • Match optical properties • Long-term (2006-2011) comparisons Altitude [km] 0 2 4 6 8 0 0.5 1 1.5 1.9 Relative Profile Ratio Relative Profile 2 1.5 1 0.5 June-August 2006-2011 van Donkelaar et al., JGR, 2013
Long-term retrievals allow trendscombined MODIS, MISR and SeaWiFS-based PM2.5 1998-2012 PM2.5 [μg/m3] van Donkelaar et al., in prep.
Global exposure and trends vary by region 1998-2012 exposure trend [μg/m3/yr] 100 80 60 40 20 0 100 80 60 40 20 0 Asia, East +1.4 North America, High Income -0.3 AQG Year 2012 2005 1998 IT3 80 60 40 20 0 Asia, South +1.0 Europe, Western -0.2 IT2 Percent of Population [%] Percent of Population [%] IT1 80 60 40 20 0 Europe, Central -0.2 North Africa,Middle East +0.4 Global: +0.6 5 10 15 25 35 50 100 5 10 15 253550 100 5 10 15 253550 100 Annual Mean Exposure [μg/m3] Annual Mean Exposure [μg/m3] van Donkelaar et al., in prep
Some Ongoing & Future Activities PCW/PHEOS Environmental Performance Index Operational AIRNow Satellite Data Processor Chinese PM2.5 Events PURE Air: Prospective Urban and Rural Epidemiological Study 1 km Optimal Estimation Retrieval Size Resolved AOD/PM2.5 Calculation ESCAPE - European Study of Cohorts for Air Pollution Effects
Short-term agreement during extreme events – Moscow 2010 65°N 60°N 55°N 50°N Before Fires July 7- July 29, 2010 During Fires July 7- July 29, 2010 120 100 80 60 40 20 0 PM2.5 [μg/m3] 35°E 45°E 55°E 35°E 45°E 55°E 1000 800 600 400 200 0 r=0.92, slope=1.06 Moscow MODIS-based PM2.5 [μg/m3] In Situ PM2.5 from PM10 MODIS/Aqua Aug 7th, 2010 In Situ PM2.5 50 km Jul-14 Jul-19 Jul-24 Jul-29 Aug-03 Aug-08 Aug-13 Aug-18 van Donkelaar et al., AE, 2011
Daily Satellite-based Estimates in North America Benefit from Spatial Smoothing & Bias Correction Bias Corrected & Smoothed, Jun 27, 2005 Error in Original (2004, 2006,2008) Error in Smoothed & Bias-corrected (2004, 2006, 2008) van Donkelaar et al., ES&T, 2012
Simulated values can constrain retrievals Optimal estimation constrains AOD retrieval by error: • GEOS-Chem provides: • AOD/PM2.5 relationship • A priori values observed TOA reflectance a priori AOD • Satellites provide: • High resolution (0.1°× 0.1°) • Observational constraint • Column-integrated value a posteriori AOD observational error Available from 2004-2011 a priori error 40 30 20 10 0 15 10 5 0 OE PM2.5[μg/m3] OE PM2.5 [μ g/m3] 0 10 20 30 40 2005 In situ PM2.5 [μg/m3] van Donkelaar et al., JGR, 2013
Sampling Station Designed for Nearly Autonomous OperationFilter Cartridges Replaced Every Two MonthsNephelometer (1 Hz) Resolves Satellite Overpass vs 24-hr Solar Capability 8-slot Filter Cartridge Collect PM2.5 & PM10 Cartridge Protects Filters
SPARTAN Activities at Dalhousie Analysis for Ions, Metals, Black Carbon (Ion Chromotraphy; Inductively Coupled Plasma Mass Spectrometry; Absorption ) Pre&PostWeigh Filters
SPARTAN Activities Beijing, China Dhaka, Bangladesh Kanpur, India Expansion & Supersite Development