Download
1 / 15
150 likes | 475 Vues
Motion Graphs. Describing the motion of an object is occasionally hard to do with words. Sometimes graphs help make the motion easier to picture, and therefore understand. Motion is a : change in position measured by distance and time Speed tells: us the rate at which an object moves

E N D
Describing the motion of an object is occasionally hard to do with words. Sometimes graphs help make the motion easier to picture, and therefore understand • Motion is a : change in position measured by distance and time • Speed tells: us the rate at which an object moves • Velocity tells: the speed and direction of moving object. • Acceleration tells: us the rate in which speed or direction changes.
Interpret the Graph Below: Time is always plotted on the X-axis (bottom of the graph). The further to the right on the axis, the longer the time from the start. Distance is plotted on the Y- axis (side of the graph) the higher up the graph, the further from the start.
Interpret the Graph Below: Time is increasing to the right, but distance does not change. It is not moving. We say it is AT REST.
Interpret the Graph Below: Time is increasing to the right, and distance is increasing constantly with time. The object moves at a constant speed. Constant speed is shown by straight lines on a graph SPEED does not change!
Interpret the Graph Below: Just like the previous graph, this graph shows an object moving with constant velocity.
Interpret the Graph Below: A steeper line indicates a larger distance moved in a given time. In other words, higher speed. Both lines are straight, so both speeds are constant
Interpret the Graph Below: The line on this graph is curving upwards. This shows an increase in speed, since the line is getting steeper: In other words, In a given, the distance the object moves is change (getting larger). It is accelerating This is acceleration.
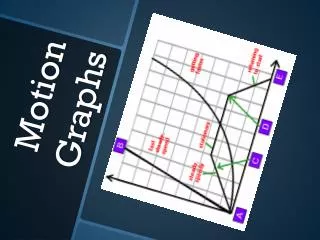
Interpret the Graph Below: In the first part of the graph, the object is moving with constant velocity. In the second part of the graph, the object is at rest (not moving). In the third part, the object is again moving with constant velocity.
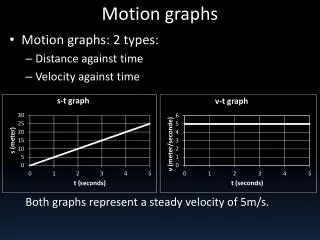
Interpret the Graph Below: Speed- Time graphs look much like Distance- Time graphs. Be sure to read the labels!!! Time is plotted on the X-axis. Speed or velocity is plotted on the Y-axis. A straight horizontal line on the speed-time graph means that speed is constant. It is NOT changing over time. A straight line does not mean that the object is not moving! Speed
Interpret the Graph Below: This graph shows increasing speed. The moving object is accelerating. Speed
Interpret the Graph Below: This graph shows decreasing speed. The moving object is decelerating. Speed
Interpret the Graph Below: Both the dashed and solid line show increasing speed. Both lines reach the same top speed, but the solid one takes longer. The dashed line shows a greater acceleration. Speed