Download
1 / 18
200 likes | 432 Vues
Motion Graphs. Motion Graphs. Pictorial representations of data (or predictions/calculations) There are two motion equations that are normally graphed Position Equation Pos f = Pos o + V o t +(1/2)at 2 (General equation) S f = S o + V o t (a = 0 so V o = V any = V)

E N D
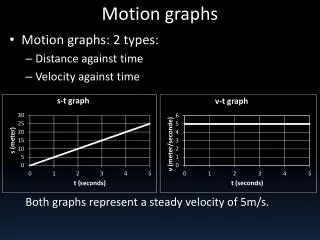
Motion Graphs • Pictorial representations of data (or predictions/calculations) • There are two motion equations that are normally graphed • Position Equation • Posf = Poso + Vot +(1/2)at2 (General equation) • Sf = So + Vot (a = 0 so Vo = Vany = V) • Velocity Equation • Vf = Vo + at (General equation) • Vf = Vo (a = 0 this is a trivial case)
Role of slope • All slopes are a ratio of changes (m =DY/DX) • In other words a slope represents the rate that the Y axis changes with respect to how the X axis changes. • For many motion graphs the X axis represents time • Position vs.. Time graph (slope = velocity) • Velocity vs.. Time graph (slope = acceleration) • There are often 4 cases that have to be recognized • Increasing slope • Decreasing slope • Constant slope • No slope
Increasing Slope (Moves away from 0) Increasing Slope (Moves away from 0) Recognizing the types of slopes Graphs of slopes 6 0 2 4 5 0 1 3 6 5 0 0 2 4 1 3
Decreasing Slope (Moves toward 0) Decreasing Slope (Moves toward 0) Recognizing types of slope P2 Graphs of slopes 6 0 2 4 5 0 1 3 6 0 2 4 5 0 1 3
Constant Slope Constant Slope Recognizing Types of Slopes P3 Graphs of slopes 6 0 2 4 5 0 1 3 6 0 2 4 5 0 1 3
No Slope No Slope Recognizing Types of Slopes P4 Graphs of slopes 6 0 2 4 5 0 1 3 6 5 4 0 0 2 1 3
Sample Problem 1 From the position versus time graph shown, graph the velocity versus time graph. Pos(t) t V(t) t
Here for one moment the slope is 0. This is a critical value. Sample Problem 2 From the position versus time graph shown, graph the velocity versus time graph. Pos(t) t V(t) t
Critical Values • Critical values is a math term for points of a graph that have zero slope. • These points are used for one of two things • A Maximum value • A Minimum value • For example a ball thrown upwards reaches maximum height (position) when its velocity (the slope of a position vs. time graph) is zero. • The maximum height is a critical value
Concavity Concavity describes the way the graph curves. Or, in other words, how the slope is changing For a position graph the concavity represents the acceleration Concavity comes in three forms Positive Concavity, Negative Concavity, and No Concavity
Positive concavity The function curves upwards Negative Concavity The function curves downwards No Concavity These are linear functions The Types of Concavity for position vs. time graphs The object’s acceleration is + The object’s acceleration is - The object’s acceleration is 0
Speeding up and slowing down • To speed up an object, it’s velocity and acceleration must be the same sign • + velocity and + acceleration • + slope and + concavity • -velocity and – acceleration • - slope and - concavity • To slow down an object, it’s velocity and acceleration must be opposite signs • + velocity and - acceleration • + slope and - concavity • -velocity and + acceleration • - slope and + concavity
Velocity Acceleration + slope + concavity Velocity Acceleration - slope - concavity Graphs of increasing velocity Position Position
Velocity Acceleration + slope - concavity Velocity Acceleration - slope + concavity Graphs of Decreasing velocity Position Position
Role of Area • Area of a graph shows up the built up effect of what is being graphed. • The area of an acceleration vs. time graph is the change in velocity • The area of a velocity vs. time graph is displacement • Areas above the X axis are + changes, while area’s below the X axis are – changes.
2m 2m 2m Velocity vs. time 2 6m Velocity (m/sec) 3 1 2 0 Time (sec) Position vs. time 6 4 Position (m) 2 3 1 2 0 Time (sec)
2.5m .5m 1.5m Velocity vs. time 4 3 Velocity (m/sec) 4.5m 2 1 Position vs. time 3 1 2 0 4 Time (sec) 3 Position (m) 2 1 3 1 2 0 Time (sec)