Download
1 / 17
170 likes | 290 Vues
Motion Graphs. 1 Dimensional Motion. Position-time graph. The object in motion would have positive and constant velocity. Position-time graph. The object in motion would have a positive but changing velocity (acceleration). Both graphs depict an object with constant and negative slope

E N D
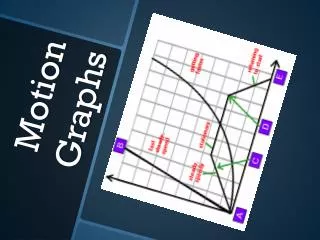
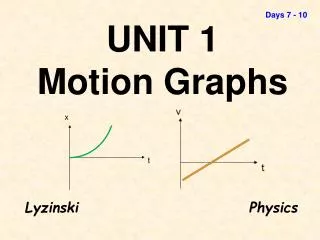
Motion Graphs 1 Dimensional Motion
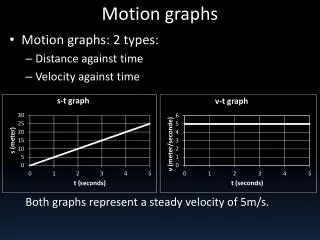
Position-time graph • The object in motion would have positive and constant velocity
Position-time graph • The object in motion would have a positive but changing velocity (acceleration)
Both graphs depict an object with constant and negative slope • The object on the right as a greater velocity
Negative acceleration • Object is moving in the negative direction and is speeding up
Velocity-Time Graph • the slope of the line on a velocity versus time graph is equal to the acceleration of the object
Slope if a velocity-time graph • Since the slope of a velocity-time graph determines the object acceleration, the objects acceleration is calculated with the following equation:
Slope of velocity-time graph • Example
Distance vs. Displacement • Distance is a scalar quantity which refers to "how much ground an object has covered" during its motion. (12m)
Distance vs. Displacement • Displacement is a vector quantity which refers to "how far out of place an object is"; it is the object's overall change in position. (0m)
Finding the displacement • The shaded area is representative of the displacement during from 0 seconds to 6 seconds. This area takes on the shape of a rectangle can be calculated using the appropriate equation.
Finding the displacement • Area of a rectangle A= b x h A= (6s) x (30m/s) A = 180m
Finding the displacement • The shaded area is representative of the displacement during from 0 seconds to 4 seconds. This area takes on the shape of a triangle can be calculated using the appropriate equation.
Finding the displacement • Area of a triangle A = ½ x b x h A = (½) x (4s) x (40m/s) A = 80 m
Finding the displacement • The shaded area is representative of the displacement during from 2 seconds to 5 seconds. This area takes on the shape of a trapezoid can be calculated using the appropriate equation.
Finding the displacement • Area of a Trapezoid A = (½) x (b) x ( h1 + h2) A = (½ )x (2s) x (10m/s +30m/s) A = 40 m