Download
1 / 1
10 likes | 68 Vues
Primer. Sequence. OPB01. 5'-GTTTCGCTCC-3'. OPB05. 5'-TGCGCCCTTC-3'. OPC08. 5'-TGGACCGGTG-3'. OPE03. 5'-CCAGATGCAC-3'. OPE11. 5'-GAGTCTCAGG-3'. OPE12. 5'-TTATCGCCCC-3'. OPE14. 5'-TGCGGCTGAG-3'. OPE16. 5'-GGTGACTGTG-3'. OPF02. 5'-GAGGATCCCT-3'. OPF10. 5'-GGAAGCTTGG-3'. OPG02.

E N D
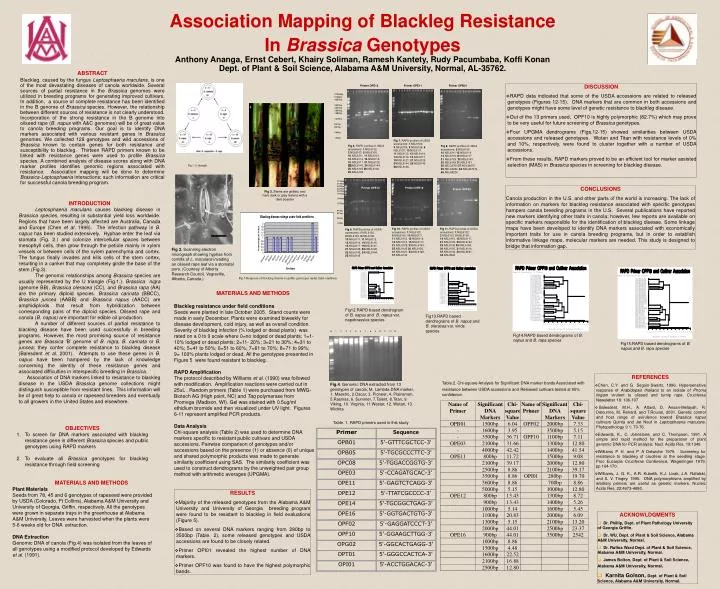
Primer Sequence OPB01 5'-GTTTCGCTCC-3' OPB05 5'-TGCGCCCTTC-3' OPC08 5'-TGGACCGGTG-3' OPE03 5'-CCAGATGCAC-3' OPE11 5'-GAGTCTCAGG-3' OPE12 5'-TTATCGCCCC-3' OPE14 5'-TGCGGCTGAG-3' OPE16 5'-GGTGACTGTG-3' OPF02 5'-GAGGATCCCT-3' OPF10 5'-GGAAGCTTGG-3' OPG02 5'-GGCACTGAGG-3' OPT01 5'-GGGCCACTCA-3' OPI01 5'-ACCTGGACAC-3' Fig 7. RAPD profiles of USDA accessions: 1.NSL6102, 3.NSL6104, 5.NSL6106, 6. NSL6107, 10.NSL6111, 11.NSL6112, 12.NSL6114, 14.NSL6116, 15.NSL6117, 19.NSL6121, 21.NSL6125, 24.NSL6144, 25.NSL6145 26.NSL6146, Fig 6. RAPD profiles of USDA accessions: 1.NSL6102, 2.NSL6103, 5.NSL6106, 10.NSL6111, 11.NSL6112, 12.NSL6114, 14.NSL6116, 15.NSL6117, 21.NSL6125, 23.NSL6143, 24.NSL6144, 25.NSL6145 26.NSL6146 29.NSL6149 Fig 8. RAPD profiles of USDA accessions: 5.NSL6106 10.NSL6111 12.NSL6114 14.NSL6116 15.NSL6117 21.NSL6125, 23.NSL6143 25.NSL6145 31.NSL6151 56.NSL32703 57.NSL34675 59.NSL42980, 64.NSL667979, 65.NSL68224, Fig 10. RAPD profiles of USDA accessions: 1.NSL6102, 5.NSL6106, 10.NSL6111, 11.NSL6112, 12.NSL6114, 14.NSL6116, 15.NSL6117, 21.NSL6125, 23.NSL6143, 25.NSL6145 30.NSL6150, 31.NSL6121, 33.NSL6126, 37.NSL6144 Fig 11. RAPD profiles of USDA accessions: 1.NSL6102, 2.NSL6103, 5.NSL6106, 14.NSL6116, 15.NSL6117, 21.NSL6125, 23.NSL6143, 25.NSL6145 26.NSL6146, 30.NSL6150, 31.NSL6114, 37.NSL6144, 40.NSL6561, 42.NSL6662 Fig 9. RAPD profiles of USDA accessions: 1.NSL6102, 2.NSL6103, 5.NSL6106, 10.NSL6111, 11.NSL6112, 12.NSL6114, 14.NSL6116, 15.NSL6117, 19.NSL6121, 21.NSL6125, 22.NSL6126, 23.NSL6143, 24.NSL6144, 25.NSL6145 Name of Primer Significant DNA Markers Chi-square Value Name of Primer Significant DNA Markers Chi-square Value OPB01 1500bp 6.04 OPF02 2000bp 7.33 - 1600bp 3.95 3500bp 5.15 - 3500bp 36.71 OPF10 1100bp 7.11 OPE03 2100bp 31.66 1300bp 12.80 - 4000bp 42.42 1400bp 41.54 OPE11 800bp 11.72 1500bp 9.08 2100bp 39.17 2000bp 12.80 2500bp 8.86 2100bp 39.17 3500bp 8.86 OPI01 280bp 19.70 3600bp 8.86 700bp 8.86 5000bp 5.15 1000bp 12.80 OPE12 800bp 13.43 1300bp 8.72 900bp 13.43 1400bp 5.26 1000bp 5.14 1600bp 5.45 Fig12.RAPD based dendrogram of B. napus and B. napus var. napobrassica species 1100bp 20.83 2000bp 6.09 1300bp 5.15 2100bp 13.20 2000bp 44.01 2500bp 23.37 OPE16 900bp 44.01 3500bp 2542 1000bp 8.86 1500bp 4.48 1600bp 22.52 2100bp 16.88 2500bp 12.80 Association Mapping of Blackleg Resistance In Brassica GenotypesAnthony Ananga, Ernst Cebert, Khairy Soliman, Ramesh Kantety, Rudy Pacumbaba, Koffi KonanDept. of Plant & Soil Science, Alabama A&M University, Normal, AL-35762. ABSTRACT Blackleg, caused by the fungus Leptosphaeria maculans, is one of the most devastating diseases of canola worldwide. Several sources of partial resistance in the Brassica genomes were utilized in breeding programs for generating improved cultivars. In addition, a source of complete resistance has been identified in the B genome of Brassica species. However, the relationship between different sources of resistance is not clearly understood. Incorporation of the strong resistance in the B genome into oilseed rape (B. napus with A&C genomes) will be of great value to canola breeding programs. Our goal is to identify DNA markers associated with various resistant genes in Brassica genomes. We collected 129 genotypes and wild accessions of Brassica known to contain genes for both resistance and susceptibility to blackleg. Thirteen RAPD primers known to be linked with resistance genes were used to profile Brassica species. A combined analysis of disease scores along with DNA marker profiles identifies genomic regions associated with resistance. Association mapping will be done to determine Brassica-Leptosphaeria interactions; such information are critical for successful canola breeding program. Primer OPE13 Primer OPE11 Primer OPB01 • DISCUSSION • RAPD data indicated that some of the USDA accessions are related to released genotypes (Figures 12-15). DNA markers that are common in both accessions and genotypes might have some level of genetic resistance to blackleg disease. • Out of the 13 primers used, OPF10 is highly polymorphic (82.7%) which may prove to be very useful for future screening of Brassica genotypes. • Four UPGMA dendrograms (Figs.12-15) showed similarities between USDA accessions and released genotypes. Wotan and Titan with resistance levels of 0% and 10%, respectively, were found to cluster together with a number of USDA accessions. • From these results, RAPD markers proved to be an efficient tool for marker assisted selection (MAS) in Brassica species in screening for blackleg disease. 21226bp 5148bp 4280bp 3530bp 2027bp 1904bp 1584bp 1375bp 947bp 831bp 564bp 125bp Fig 1. U triangle 21226bp 5148bp 4280bp 3530bp 2027bp 1904bp 1584bp 1375bp 947bp 831bp 564bp 125bp Primer OPE12 Primer OPE16 CONCLUSIONS Canola production in the U.S. and other parts of the world is increasing. The lack of information on markers for blackleg resistance associated with specific genotypes hampers canola breeding programs in the U.S. Several publications have reported new markers identifying other traits in canola; however, few reports are available on specific markers responsible for the identification of blackleg disease. Some linkage maps have been developed to identify DNA markers associated with economically important traits for use in canola breeding programs, but in order to establish informative linkage maps, molecular markers are needed. This study is designed to bridge that information gap. Primer OPF02 Fig 3. Stems are girdled, and have dark or grey lesions with a dark boarder INTRODUCTION Leptosphaeria maculans causes blackleg disease in Brassica species, resulting in substantial yield loss worldwide. Regions that have been largely affected are Australia, Canada and Europe (Chen et al. 1996). The infection pathway in B. napus has been studied extensively. Hyphae enter the leaf via stomata (Fig. 2.) and colonize intercellular spaces between mesophyll cells, then grow through the petiole mainly in xylem vessels or between cells of the xylem parenchyma and cortex. The fungus finally invades and kills cells of the stem cortex, resulting in a canker that may completely girdle the base of the stem (Fig.3). The genomic relationships among Brassica species are usually represented by the U triangle (Fig.1.). Brassica nigra (genome BB), Brassica oleracea (CC), and Brassica rapa (AA) are the primary diploid species. Brassica carinata (BBCC), Brassica juncea (AABB) and Brassica napus (AACC) are amphidiploids that result from hybridization between corresponding pairs of the diploid species. Oilseed rape and canola (B. napus) are important for edible oil production. A number of different sources of partial resistance to blackleg disease have been used successfully in breeding programs. However, the most promising source of resistance genes are Brassica ‘B’ genome of B. nigra, B. carinata or B. juncea; they confer complete resistance to blackleg disease (Balesdent et al. 2001). Attempts to use these genes in B. napus have been hampered by the lack of knowledge concerning the identity of these resistance genes and associated difficulties in interspecific breeding in Brassica. Association of DNA markers linked to resistance to blackleg disease in the USDA Brassica genome collections might distinguish susceptible from resistant lines. This information will be of great help to canola or rapeseed breeders and eventually to all growers in the United States and elsewhere. Fig 2. Scanning electron micrograph showing hyphae from conidia of L. maculans invading an oilseed rape leaf via a stomatal pore. (Courtesy of Alberta Research Council, Vegreville, Alberta, Canada.) Fig 5 Response of blackleg disease to public genotypes under field condition MATERIALS AND METHODS Blackleg resistance under field conditions Seeds were planted in late October 2005. Stand counts were made in early December. Plants were examined biweekly for disease development, cold injury, as well as overall condition. Severity of blackleg infection (% lodged or dead plants) was rated on a 0 to 9 scale where 0=no lodged or dead plants; 1=1- 10% lodged or dead plants; 2=11- 20%; 3=21 to 30%; 4=31 to 40%; 5=41 to 50%; 6=51 to 60%; 7=61 to 70%; 8=71 to 99%; 9= 100% plants lodged or dead. All the genotypes presented in Figure 5 were found resistant to blackleg. RAPD Amplification The protocol described by Williams et al. (1990) was followed with modification. Amplification reactions were carried out in 25uL . Random primers (Table 1) were purchased from MWG-Biotech AG (High point, NC) and Taq polymerase from Promega (Madison, WI). Gel was stained with 0.5ug/ml ethidium bromide and then visualized under UV light. Figures 6-11 represent amplified PCR products. Data Analysis Chi-square analysis (Table 2) was used to determine DNA markers specific to resistant public cultivars and USDA accessions. Pairwise comparison of genotypes and/or accessions based on the presence (1) or absence (0) of unique and shared polymorphic products was made to generate similarity coefficient using SAS. The similarity coefficient was used to construct dendrograms by the unweighted pair group method with arithmetic averages (UPGMA). Fig13.RAPD based dendrograms of B. napus and B. oleracea var. virids species M 1 2 3 4 5 6 7 8 9 10 11 12 13 Fig14.RAPD based dendrograms of B. napus and B. rapa species Fig15.RAPD based dendrograms of B. napus and B. rapa species • REFERENCES • Chen, C.Y. and G. Seguin-Swartz, 1996. Hypersensitive response of Arabidopsis thaliana to an isolate of Phoma lingam virulent to oilseed and turnip rape. Cruciferae Newsletter 18: 106-107 • Balesdent, M.H., A. Attard, D. Ansan-Melayah, R. Delourme, M. Renard, and T.Rouxel, 2001. Genetic control and host range of avirulence toward Brassica napus cultivars Quinta and Jet Neuf in Leptosphaeria maculans. Phytopathology 9 1: 70-76. • Edwards, K., C. Johnstone, and C. Thompson. 1991. A simple and rapid method for the preparation of plant genomic DNA for PCR analysis. Nucl. Acids Res. 19:1349 • Williams P H. and P A Delwiche 1979. Screening for resistance to blackleg of crucifers at the seedling stage. Proc Eucarpia Cruciferae Conference, Wageningen 1979, pp 164-170. • Williams, J. G. K., A.R. Kubelik, K.J. Livak, J.A. Rafalski, and S. V. Tingey. 1990. DNA polymorphisms amplified by arbitrary primers are useful as genetic markers. Nucleic Acids Res. 22:4673-4680. Table.2. Chi-square Analysis for Significant DNA marker bands Associated with resistance between USDA accessions andReleased cultivars tested at 95% confidence. Fig.4. Genomic DNA extracted from 13 genotypes of canola; M. Lambda DNA marker, 1. Maestro, 2.Oscar, 3. Pioneer, 4. Plainsman, 5.Rasmas, 6. Summer, 7.Talent, 8.Titan, 9. Viking, 10. Virginia, 11.Westar, 12. Wotan, 13. Wichita Table. 1. RAPD primers used in this study • OBJECTIVES • To screen for DNA markers associated with blackleg resistance gene in different Brassica species and publicgenotypes using RAPD markers • To evaluate all Brassica genotypes for blackleg resistance through field screening MATERIALS AND METHODS Plant Materials Seeds from 78, 45 and 6 genotypes of rapeseed were provided by USDA (Colorado, Ft Collins), Alabama A&M University and University of Georgia, Griffin, respectively. All the genotypes were grown in separate trays in the greenhouse at Alabama A&M University. Leaves were harvested when the plants were 5-6 weeks old for DNA extraction. DNA Extraction Genomic DNA of canola (Fig.4) was isolated from the leaves of all genotypes using a modified protocol developed by Edwards et al. (1991). • RESULTS • Majority of the released genotypes from the Alabama A&M University and University of Georgia breeding program were found to be resistant to blackleg in field evaluations (Figure 5). • Based on several DNA markers ranging from 280bp to 3500bp (Table. 2), some released genotypes and USDA accessions are found to be closely related. • Primer OPI01 revealed the highest number of DNA markers. • Primer OPF10 was found to have the highest polymorphic bands. • ACKNOWLDGMENTS • Dr. Phillip, Dept. of Plant Pathology University of Georgia Griffin. • Dr. WU, Dept. of Plant & Soil Science, Alabama A&M University, Normal. • Dr. Rufina Ward Dept. of Plant & Soil Science, Alabama A&M University, Normal. • James Bolton, Dept. of Plant & Soil Science, Alabama A&M University, Normal. • Karnita Golson, Dept. of Plant & Soil Science, Alabama A&M University, Normal.