Download
1 / 27
270 likes | 276 Vues
Some examples of exploiting remote sensing data in model evaluation. Richard Allan, Tristan Quaife (NCEO Reading) UKESM meeting, April 12 th 2018. All-sky Clear-sky. Radiative biases in Met Office global NWP model. Mineral dust. Convective outflow. Shortwave Longwave.

E N D
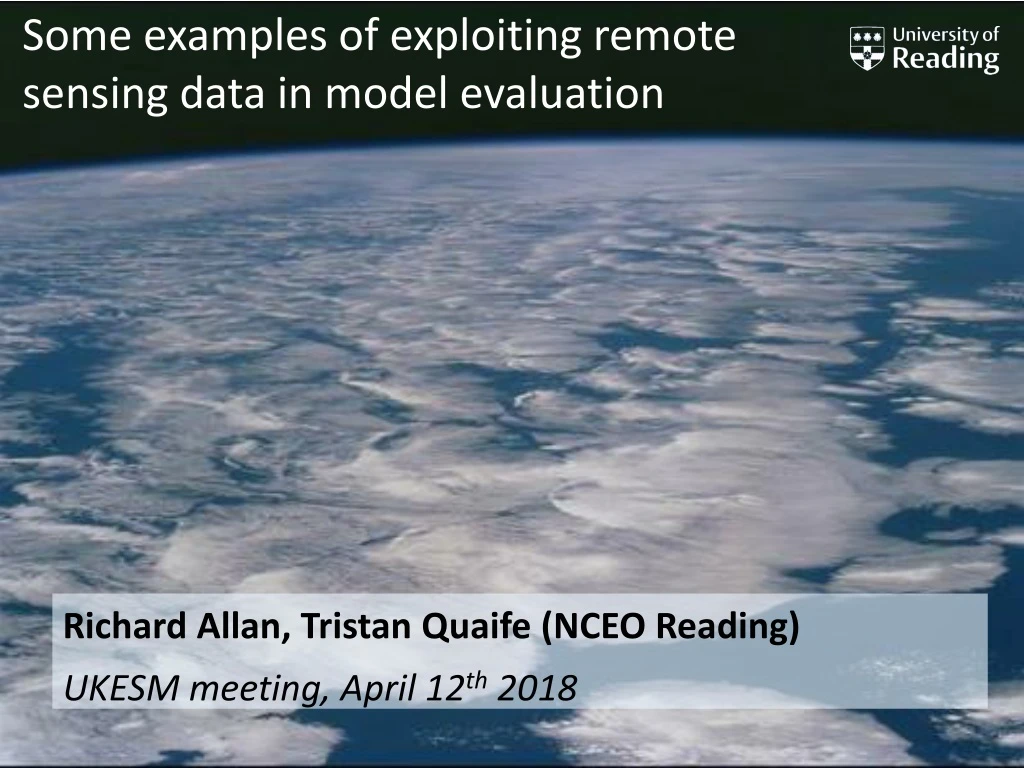
Some examples of exploiting remote sensing data in model evaluation Richard Allan, Tristan Quaife (NCEO Reading) UKESM meeting, April 12th 2018
All-sky Clear-sky Radiative biases in Met Office global NWP model Mineral dust Convective outflow Shortwave Longwave Exploiting GERB to improve Met Office forecast model physics Surface albedo Convective cloud Marine stratocumulus Allan et al (2007) QJRMS
Evaluating cloud-aerosol interaction: natural laboratory Cloud droplet size MODIS-Aqua HadGEM3 Malavelle et al. (2017) Nature • Volcanic aerosol haze causes noticeable expected decrease in cloud drop size • Further indirect effects of aerosol haze on cloud water were undetectable in observations but large in some climate model simulations
Interpreting & connecting systemic model biases Combine top of atmosphere radiation budget data with reanalyses in evaluating surface energy budget, energy flows and systemic precipitation biases in CMIP5 simulations. Loeb et al. (2016) Clim. Dyn See also Liu et al. (2017) JGR; Stephens et al. 2016 CCCR Models with large precip biases (left) underestimate south hemisphere cloud reflection
Precipitation extremes 99th% • Evaluation across intensity bins to avoid spatial mismatches • 5-day means chosen; inconsistent time-sampling at “daily” scale • Possible “emergent constraints” from variability on future projections Allan et al. (2014) Surv. Geophys light heavy
Using dynamical regime composites to analyse precipitation Subtropical, dry Model ensemble mean GPCP observations Stronger ascent Precipitation (mm/day) Warmer surface temperature Extra-tropical Tropical moist Allan (2012) Clim. Dyn • Composite precipitation by percentiles of vertical motion (strong decent to strong ascent) and temperature • Contour values enclose % of total area (left) or show percentage contribution of each composite box to total area (right)
Deficient CMIP5 simulation of seasonal rainfall over West Africa Coupled models fail to simulate biannual precipitation regime in coastal west Africa Dunning et al. 2017 ERL Atmosphere-only simulationscapture seasonal cycle, coupled simulations don’t Relates to bias in Gulf of Guinea sea surface temperature (SST) & deficient representation of SST/rainfall relationship: See also Okumura & Xie (2004) J. Clim., Cabos et al. (2017) Clim. Dyn. SST seasonal cycle CMIP5 OBS/AMIP Richard Allan | University of Reading r.p.allan@reading.ac.uk @rpallanuk
Soil moisture and the carbon cycle • Part of the story with getting the C-cycle response to precipitation right is getting the model soil moisture response to precipitation correct • EO derived soil moisture still has some significant caveats with regard to making comparisons with models BUT has a relatively long time series (since mid 1980s) and does a reasonable job of representing the seasonal cycle
Bias in JULES soil moisture vs. ESA CCI data Default JULES soil ancillaries Pinnington, E., Quaife, T., and Black, E.: Using satellite observations of precipitation and soil moisture to constrain the water budget of a land surface model, Hydrol. Earth Syst. Sci. Discuss., https://doi.org/10.5194/hess-2017-705 New JULES soil ancillaries getting precipitation right is crucial for the start of season wetting-up, whereas getting the soil description right is crucial for the end of season dry-down
Evaluating model response to ENSO Woodward, F.I., Lomas, M.R. and Quaife, T., 2008. Global responses of terrestrial productivity to contemporary climatic oscillations. Philosophical Transactions of the Royal Society B: Biological Sciences, 363(1504), pp.2779-2785.areas considered in the discussion. Model correlation with MEI NDVI correlation with MEI Key result from this paper was that the model (SDGVM) is overly reliant on precipitation to prescribe the response of vegetation to ENSO. Subsequent papers have shown this to be true for a number of other models.
Many EO based C-cycle products not suitable for evaluation of ESMs • A clear example is the MODIS GPP product • It is, essentially, a very simple model on top of other retrieved variables (LAI and fAPAR) • Also include some driving climate data • Similar arguments can be made about other EO products
MODIS GPP MODIS data Look up table Climate data http://www.ntsg.umt.edu/remote_sensing/netprimary/
Vegetation indices – NDVI and co. • Vegetation indices should be used with caution • Their simplicity makes them attractive but they do not tend to perform reliably when trying to make physical inferences from them • HOWEVER… • It is possible to forward model NDVI directly from UKESM • If we want to evaluate against long timescale (30+ years) EO records of vegetation activity they are probably our only choice
What could we do better: Use albedo • Available for the same time period as NDVI (since early 1980s) • Physically meaningful variable • Calculated by JULES in both NIR and PAR domains • BUT… • Interpretation w.r.t. the C-cycle is more complex than NDVI • There are some issues with the physical representation of canopy albedo in most land surface models, primarily to do with the physical structure of the canopy… • But, of course, these issues also affect anything derived with optical EO data in principle ,so really also apply to NDVI, LAI, GPP etc etc.
What could we do better: Use SIF • Solar Induced Fluorescence (SIF) • A seemingly direct observation of GPP • Physically meaningful variable with direct implications for the C-cycle • BUT… • Not directly modelled by JULES so probably compare with GPP • Still a lot need to be understood about the […?] • Time series are relatively short (less than 10 years)
Testing VCmax hypotheses against SIF Walker, A.P., Quaife, T., Bodegom, P.M., De Kauwe, M.G., Keenan, T.F., Joiner, J., Lomas, M.R., MacBean, N., Xu, C., Yang, X. and Woodward, F.I., 2017. The impact of alternative trait‐scaling hypotheses for the maximum photosynthetic carboxylation rate (Vcmax) on global gross primary production. New Phytologist, 215(4), pp.1370-1386. A global test of various hypotheses about max rate of carboxylation (a key parameter for photosynthesis) in SDGVM as tested, globally, against SIF observations from NASA OCO2.
Conclusions • You can get a long way with simple evaluation (e.g. radiation) • But advances requires multi-satellite/model analysis • Model to observation or observation to model approaches • Most observations involve detailed modelling • pdfs and suitable compositing/averaging can aid interpretation • We should avoid “high level” EO products (e.g. GPP & LAI) • NDVI & soil moisture probably necessary evils for time being • Evaluation against albedo should be a priority as it tells us much more about the physics of the model (includes info in NDVI and more) • SIF shows a lot of promise – it is possibly the only direct(ish) observation of photosynthesis on large scales available
Diverse simulated cloud response to volcanic aerosol emissions Malavelle et al. (2017) Nature
Volcanic aerosol haze causes noticeable expected decrease in cloud drop size MODIS-Aqua Observations Cloud water Droplet size Malavelle et al. (2017) Nature Further indirect effects of aerosol haze on cloud water undetectable
Volcanic aerosol haze causes noticeable expected decrease in cloud drop size HadGEM3 simulations Cloud water Droplet size Malavelle et al. (2017) Nature Further indirect effects of aerosol haze on cloud water undetectable
TOA irradiance • Influence of cloud/aerosol interaction on TOA shortwave undetectable above weather noise • Swath level measurements required to further evaluation Malavelle et al. (2017) Nature
Conclusions • Extended Top of atmosphere radiation dataset (Allan et al. 2014 GRL) • Earth’s energy imbalance relatively stable (~0.7 Wm-2), increased since 1980s? • New method for deriving surface energy flux (Liu et al. 2017 JGR) • How do clouds and surface fluxes determine decadal climate variability? • Link between hemispheric energy balance and climate • Observed constraint on aerosol-cloud interactions (Malavelle et al. 2017 Nature) • Use volcano to mimic aerosol pollution haze • Decrease in cloud droplet size detectable • Further indirect effects on cloud and the radiation budget not distinguishable from weather noise
RAMI4PILPS Bottom line is that JULES is OK but has some issues representing some photon scattering processes (see that red box!). Note, however, that most of the other models in the exercise were not global land models. Widlowski, J.L., Pinty, B., Clerici, M., Dai, Y., De Kauwe, M., De Ridder, K., Kallel, A., KobayaRAMI4PILPS: An intercomparison of formulations for the partitioning of solar radiation in land surface models. Journal of Geophysical shi, H., Lavergne, T., Ni‐Meister, W. and Olchev, A., 2011. Research: Biogeosciences, 116(G2).
RAMI4PILPS revisited JULES is represented by this triangle in each square. Each square represents a specific experiment. Upshot – compared with JSBACH and ORCHIDEE, JULES is pretty good! Yes – I know it’s a horrible figure Loew, Alexander, P. M. van Bodegom, J-L. Widlowski, Juliane Otto, Tristan Quaife, Bernard Pinty, and Thomas Raddatz. "Do we (need to) care about canopy radiation schemes in DGVMs? An evaluation and assessment study." Biogeosciences Discussions 10, no. 10 (2013): 16551-16613.
Implications for radiative forcing Loew, Alexander, P. M. van Bodegom, J-L. Widlowski, Juliane Otto, Tristan Quaife, Bernard Pinty, and Thomas Raddatz. "Do we (need to) care about canopy radiation schemes in DGVMs? An evaluation and assessment study." Biogeosciences Discussions 10, no. 10 (2013): 16551-16613.
Malavelle et al. (2017) Nature Advancing understanding of volcanic aerosol effects on climate MODIS-Aqua Observations Cloud water Droplet size • Volcanic aerosol haze brightens low altitude clouds, cooling climate • Further indirect effects in cloud water found to be negligible • Results will help to improve climate change projections • New assessment of direct volcanic influence on climate combining nudged models & observations Schmidt et al. (2017) in prep