Download
1 / 59
1.15k likes | 2.34k Vues
Fourier Transform IR (FTIR). Most modern IR absorption instruments use Fourier transform techniques with a Michelson interferometer . To obtain an IR absorption spectrum, one mirror of the interferometer moves to generate interference in the radiation reaching the detector.

E N D
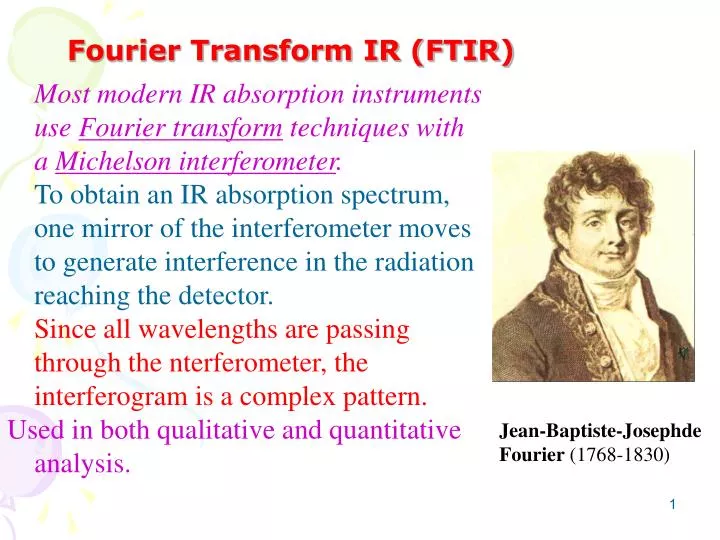
Fourier Transform IR (FTIR) Most modern IR absorption instruments use Fourier transform techniques with a Michelson interferometer. To obtain an IR absorption spectrum, one mirror of the interferometer moves to generate interference in the radiation reaching the detector. Since all wavelengths are passing through the nterferometer, the interferogram is a complex pattern. Used in both qualitative and quantitative analysis. Jean-Baptiste-Josephde Fourier (1768-1830)
How FTIR works? • Source: Infrared energy is emitted from a glowing black-body source. Ends at the Detector • Interferometer: beam enters the interferometer where the “spectral encoding” takes place • Interferogram signal then exits the interferometer • Beamsplittertakes the incoming beam and divides it into two optical beams • Sample: beam enters the sample compartment where it is transmitted through or reflected off of the surface of the sample • Detector: The beam finally passes to the detector for final measurement • Computer: measured signal is digitized and sent to the computer where the Fourier transformation takes place • Movingmirrorin the interferometer is the only moving part of the instrument • Fixedmirror
Michelson Interferometer Frequency domain Time domain (coding) Coding spectra decoding Albert Abraham Michelson (1852-1931)
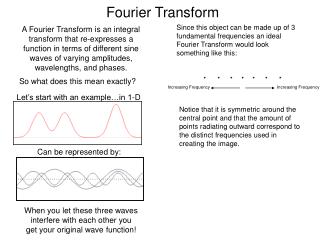
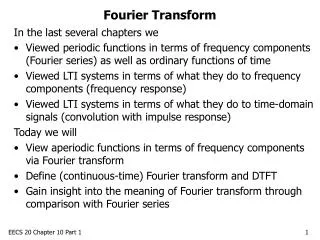
Fourier Transform Infrared Spectroscopy Normal spectrum: (Frequency domain) plot of I(n) vs n Intensity as a function of frequencyvs.frequency Time domain: plot of I(t) vs t t = 1/n) Called the Fourier Transform of the frequency spectrum Each version of the spectrum contains the same information Conversion to one form to the other can be accomplished by a computer
Transfer interferogram to absorption spectrum FFT: Fast Fourier Transformation
Michelson Interferometer Based on interference of waves In-phase: constructive Out-of-phase: destrictive
Michaelson Interferometer • Beam splitter • Stationary mirror • Moving mirror at constant velocity • He/Ne laser; sampling interval, control mirror velocity
FTIR spectroscopy • Based on the use of an optical modulator: interferometer • Interferometer modulates radiation emitted by an IR-source, producing an interferogram that has all infrared frequencies encoded into it • Interferometer performs an optical Fourier Transform on the IR radiation emitted by the IR source • The whole infrared spectrum is measured at high speed. • Spectral range is continuously calibrated with He-Ne laser • Fast, extremely accurate measurements Interferometer Modulated IR Beam Interferogram Fourier Transformation IR Spectrum
Moving mirror IR Source Stationary mirror Beamsplitter Michelson interferometer • Simplest interferometer design • Beamsplitter for dividing the incoming IR beam into two parts • Two plane mirrors for reflecting the two beams back to the beam splitter where they interfere either constructively or destructively depending on the position of the moving mirror • Position of moving mirror is expressed as Optical Path Difference (OPD) OPD = Distance travelled by red beam minus distance travelled by yellow beam
Interference • Electromagnetic (EM) radiation can be described as sine waves having definite amplitude, frequency and phase • When EM-waves interact, interference is observed • Depending on the relative phase of the waves, interference is either destructive or constructive constructive interference destructive interference A A A A Interference signal Interference signal EM waves with same amplitude and frequency, out of phase EM waves with same amplitude and frequency, in phase (OPD = 0)
Mirror movement and interference of single wavelength beam OPD = 0 at the white line When moving mirror is in the original position, the two paths are identical and interference is constructive When the moving mirror moves ¼ of wavelength, the path difference is ½ wavelength and interference is destructive OPD= 2(MM-FM) = Mirror moves back and forth at constant velocity – the intensity of the interference signal varies as a sine wave OPD = Distance travelled by red beam minus distance travelled by yellow beam
Explanation: • Considering a single-frequency component from the IR source reach the detector where the source is monochromatic, such as a laser source. • Differences in the optical paths between the two split beams are created by varying the relative position of moving mirror to the fixed mirror. • If the two arms of the interferometer are of equal length, the two split beams travel through the exact same path length. • The two beams are totally in phase with each other; thus, they interfere constructively and lead to a maximum in the detector response. • This position of the moving mirror is called the point of zero path difference (ZPD).
When the moving mirror travels in either direction by the distance l/4, the optical path (beamsplitter–mirror–beamsplitter) is changed by 2 (l/4), or l/2. • The two beams are 180° out of phase with each other, and thus interfere destructively. • As the moving mirror travels another l/4, the optical path difference is now 2 (l/2), or l. • The two beams are again in phase with each other and result in another constructive interference. • When the mirror is moved at a constant velocity, the intensity of radiation reaching the detector varies in a sinusoidal manner to produce the interferogram output. • The interferogram is the record of the interference signal. • It is actually a time domain spectrum and records the detector response changes versus time within the mirror scan.
I (X) Interference of two beams of light FTIR seminar Movable mirror Fixed mirror A Movable mirror Same-phase interference wave shape -2l -l 0 l 2l Continuous phase shift Fixed mirror B Movable mirror Opposite-phase interference wave shape Signal strength Fixed mirror C Movable mirror -2l -l 0 l 2l Same-phase interference wave shape 0 l DInterference pattern of light manifested by the optical-path difference
More than one frequency: • Extension of the same process to three component frequencies results in a more complex interferogram, which is the summation of three individual modulated waves. Broad band IR source: • In contrast to this simple, symmetric interferogram, the interferogram produced with a broadband IR source displays extensive interference patterns. • It is a complex summation of superimposed sinusoidal waves, each wave corresponding to a single frequency. Absorption radiation by sample: When this IR beam is directed through the sample, the amplitudes of a set of waves are reduced by absorption (with an amount proportional to the amount of sample in the beam) if the frequency of this set of waves is the same as one of the characteristic frequencies of the sample.
How Fourier transform infrared spectrometry is created. • The interferogram contains information over the entire IR region to which the detector is responsive. • A mathematical operation known as Fourier transformation converts the interferogram (a time domain spectrum displaying intensity versus time within the mirror scan) to the final IR spectrum, which is the familiar frequency domain spectrum showing intensity versus frequency. • The detector signal is sampled at small, precise intervals during the mirror scan. Control of sampling: • The sampling rate is controlled by an internal, independent reference, a modulated monochromatic beam from a helium • neon (HeNe) laser focused on a separate detector.
Fourier transformation Intensity Intensity Fourier transformation pair OPD / cm Wave number / cm-1 Time Domain Frequency Domain 113
Where: f=2M ' = OPD
FT IR Detectors: The two most popular detectors for a FTIR spectrometer are: • deuterated triglycine sulfate (DTGS): Is a pyroelectric detector that delivers rapid responses because it measures the changes in temperature rather than the value of temperature. It operates at room temperature, • mercury cadmium telluride (MCT). Is a photon (or quantum) detector that depends on the quantum nature of radiation and also exhibits very fast responses. It must be maintained at liquid nitrogen temperature (77 °K) to be effective. In general, the MCT detector is faster and more sensitive than DTGS detector. Thermal Detectors are not used in FT IR: • The response times of thermal detectors (for example, thermocouple and thermistor) used in dispersive IR instruments are too slow for the rapid scan times (1 sec or less) of the interferometer.
Sequence for Obtaining Spectrum • Interferogram of Background is obtained (without sample) • System uses Fourier Transform to create single beam background spectrum. • Interferogram of Sample is obtained. • System uses Fourier Transform to create single beam spectrum of sample. • System calculates the transmittance or absorbance spectrum.
Transmittance spectrum Background Interferogram with N2 Single beam sample spectrum Absorbance spectrum Interferogram with sample Measurement sequence • Transmittance spectrum is a single beam sample divided by background • Absorbance spectrum = negative logarithm of transmittance • Automatically converts and displays spectra as absorbance spectra
FT Optical System Diagram FTIR seminar Light source He-Ne gas laser (ceramic) Beam splitter Movable mirror Sample chamber (DLATGS) Fixed mirror Detector Interferometer
Relation between optical frequency and interferometer frequency • OPD = 2(MM-FM)= (retardation) • When output power from the detector plot versus it gives interferogram. • Frequency of the interferometer resulted source frequency • Relationship between the two frequencies: • One cycle of signal occurs when the mirror moves a distance of /2. • Assuming constant velocity of the MM of M and as time required for mirror to move /2 so: • M = /2 • The frequency of signal at the detector is the reciprocal of : • = 1/ = M / (/2) = 2 M / • = 2 M ’ • as = c/ • where is the frequency of the radiation and c is the velocity of light. At constant M • (interferogram frequency) (optical frequency)
For example. If the mirror is driven at a rate of 1.5 cm/s. = 2x1.5 cm/s = 10-10 3x1010 cm/s = 2 M /
FT-IR Advantages 1) Fellgett's (multiplex) Advantage (High S/N ratio comparing with dispersive instruments) • FT-IR collects all resolution elements with a complete scan of the interferometer. • Successive scans of the FT-IR instrument are coded and averaged to enhance the signal-to-noise of the spectrum. • Theoretically, an infinitely long scan would average out all the noise in the baseline. • The dispersive instrument collects data one wavelength at a time and collects only a single spectrum. • There is no good method for increasing the signal-to-noise of the dispersive spectrum.
2- Connes Advantage High resolution, reproducibility and highly accurate frequency determination • - Technique allows high speed sampling with the aid of laser light interference fringes • - Requires no wavenumber correction • Provides wavenumber to an accuracy of 0.01 cm-1 • 3- Much higher E throughput (Jacquinot or Throughput advantage): • Because not using classical monochromator. • Requires no slit device, making good use of the available beam
4- Better sensitivity. • - In the interferometer, the radiation power transmitted on to the detector is very high which results in high sensitivity. • - Allowssimultaneous measurement over the entire wavenumber range • 5- No Stray light • - Fourier Transform allows only interference signals to contribute to spectrum. • Background light effects greatly lowers. • - Allows selective handling of signals limiting intreference • 6. Wavenumber range flexibility • Simple to alter the instrument wavenumber range
Disadvantages of FTIR compared to Normal IR: 1) single-beam, requires collecting blank 2) can’t use thermal detectors – too slow 3) CO2 and H2O sensitive 4)Destructive 5)Too sensitive that it would detect the smallest contaminant
Uses of FTIR in Chemistry areas • Opaque or cloudy samples • Energy limiting accessories such as diffuse reflectance or FT-IR microscopes • High resolution experiments (as high as 0.001 cm-1 resolution) • Trace analysis of raw materials or finished products • Depth profiling and microscopic mapping of samples • Kinetics reactions on the microsecond time-scale • Analysis of chromatographic and thermogravimetric sample fractions. • Substances of weak absorption samples. • IR emission studies.
Forensic Lab use: • A Forensic Scientist would use FT-IR to identify chemicals in different types of samples: • Paints • Polymers • Coatings • Rugs • Contaminants • Explosive residues
FT-IR Terms and Definitions Resolution (common definition) The separation of the various spectral wavelengths, usually defined in wavenumbers (cm-1). A setting of 4 to 8 cm-1 is sufficient for most solid and liquid samples. Gas analysis experiments may need a resolution of 2 cm-1 or higher. Higher resolution experiments will have lower signal-to-noise.
Some FTIR scanning parameters • Resolution • Two widely-spaced lines: Taking data over a short path difference (time) is sufficient to resolve the lines. • Two close lines: The interferogram must be measured over a longer path difference (time) to get a satisfactory spectrum. • Two closely spaced lines only eparated if one complete "beat" is recorded. As lines get closer together, must increase
What is optical path difference and mirror movement for a resolution 4 cm-1? Typical spectral resolution for routine work is 4 cm-1, although most laboratory IR instruments have resolutions down to 0.5-2 cm-1. Be careful to set same resolution parameter when matching spectra, such as unknown sample and library spectrum.
Light Source Michelson Interferometer Detector Sample Electronics Computer A Simple FTIR Spectrometer
Components of FTIR Instrument • Majority of FTIR instruments are based on Michelson interferometer. • *Derive mechanism For satisfactory interferogram (and thus spectra) of interferometer: • need to know speed and position of moving mirror at all time to within a fraction of . • Planarity of mirror must also remain constant during entire sweeping of 10 cm or more. • In far IR (50-1000 m, 200-10 cm-1): This can be accomplished with a motor driven micrometer screw • Near and mid IR: • Need more precision Mirror floated on an air bearing • Held in close fitting stainless steel sleeve • DC coil pushes plunger back and forth • Drive length 1 to 20 cm-1 • Scan rate .01 to 10 cm/s
Additional features of the mirror system • Need to sample signal at precise intervals. • Need to know zero retardation point exactly for signal averaging. • If this point is not known precisely signals of repetitive sweeps would not be in phase (degradation of signals and not improvement) • One way to do this is to have 3 interferometers built into • same moving mirror. • 1st system is the IR sampling system: Provides the ordinary interferogram. • 2nd system uses a helium/neon laser (laser-fringe reference). Provides sampling-interval information. • Has a single frequency • Creates a simple cosine wave pattern converted to square –wave form. • Use to keep track of mirror speed • Used to trigger sampling electronics • Sampling begins and terminates at each successive zero crossing. • Gives highly reproducible and regularly spaced sampling intervals. • Used to control speed of mirror-drive system at constant level.
3rd system called the white-light system: • Tungsten source and visible sensitive transducer • Polychromatic source so largest signal is at zero position • As get off zero, some light interferes and intensity decreases. • Look for max signal, know where zero position is. • High reproducibility is important for averaging of many scans. • Triple system extremely accurate and reproducible. • Current instruments use a single interferometer with a laser, and get zero position from max of IR signal.
Principle of operation of FTIR spectrometer sample white light laser square wave from laser
Optical path difference Recording an interferogram • Laser interferogram signal is used to digitize the IR interferogram • Single mode HeNe-laser provides a constant wavelength output at 632.8 nm • Accurate and precise digitization interval provides high wavelength accuracy in the spectrum • The data points for IR interferogram are recorded every time the mirror has moved forward by one HeNe laser wavelength Infrared source Infrared source Helium-Neon laser Helium-neon laser 0 -L
FTIR seminar Sampling of an actual interferogram Interferometer interferogram Output of a Laser interferometer Primary interferometer interferogram that was sampled Optical path difference x


![Fourier transform infrared spectroscopy[FTIR]](https://cdn1.slideserve.com/2743434/fourier-transform-infrared-spectroscopy-ftir-dt.jpg)