Download
1 / 36
1.05k likes | 3.06k Vues
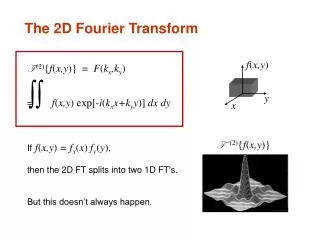
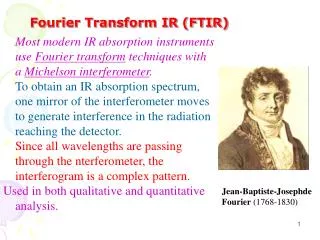
Fourier Transform Infrared (FT-IR) Spectroscopy. Theory and Applications. THE ELECTROMAGNETIC SPECTRUM. INFRARED. GAMMA RAYS X RAYS UV VISIBLE. Introduction to FTInfrared Spectroscopy. What is infrared spectroscopy? Theory of FT-IR

E N D
Fourier Transform Infrared (FT-IR) Spectroscopy Theory and Applications THE ELECTROMAGNETIC SPECTRUM INFRARED GAMMA RAYS X RAYS UV VISIBLE
Introduction to FTInfrared Spectroscopy • What is infrared spectroscopy? • Theory of FT-IR • FT-IR Advantages? • New FT/IR4000-6000Series
What is the basic principle of IR spectroscopy? IR radiation does not have enough energy to induce electronic transitions as seen with UV. Absorption of IR is restricted to compounds with small energy differences in the possible vibrational and rotational states. For a molecule to absorb IR, the vibrations or rotations within a molecule must cause a net change in the dipole moment of the molecule. The alternating electrical field of the radiation (remember that electromagnetic radation consists of an oscillating electrical field and an oscillating magnetic field, perpendicular to each other) interacts with fluctuations in the dipole moment of the molecule. If the frequency of the radiation matches the vibrational frequency of the molecule then radiation will be absorbed, causing a change in the amplitude of molecular vibration.
What is Infrared? • Infrared radiation lies between the visible and microwave portions of the electromagnetic spectrum. • Infrared waves have wavelengths longer than visible and shorter than microwaves, and have frequencies which are lower than visible and higher than microwaves. • The Infrared region is divided into: near, mid and far-infrared. • Near-infrared refers to the part of the infrared spectrum that is closest to visible light, 14000–4000 cm−1 (0.8–2.5 μm wavelength) and far-infrared refers to the part that is closer to the microwave region, 400–10 cm−1 (25–1000 μm). • Mid-infrared is the region between these two, 4000–400 cm−1 (2.5–25 μm). • The primary source of infrared radiation is thermal radiation. (heat) • It is the radiation produced by the motion of atoms and molecules in an object. The higher the temperature, the more the atoms and molecules move and the more infrared radiation they produce. • Any object radiates in the infrared. Even an ice cube, emits infrared.
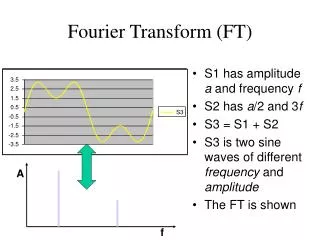
An IR spectrum show the energy absorptions as one 'scans' the IR region of the EM spectrum. As an example, the IR spectrum of butanal is shown below. • In general terms it is convenient to split an IR spectrum into two approximate regions: • 4000-1000 cm-1 known as the functional group region, and • < 1000 cm-1 known as the fingerprint region
Applications Infrared (IR) spectroscopy is used to obtain information on the molecular structure of virtual all type of samples in any physical state (solid, liquid or gas). The technique is widely spread and is applied in the polymer, pharmaceutical, medical, food and chemical industry. •identification of inorganic and organic materials •purity control of materials •reaction kinetics e.g. conversion of polymers, curing acrylics, hybrid systems •troubleshooting •identification of monomers and polymers; resins, hardeners, stabilizers, plasticizers, fillers, adhesives, oils and waxes •identification of solvents and extracts •identification and quantification of contaminants on surfaces
What is Infrared? (Cont.) Humans, at normal body temperature, radiate most strongly in the infrared, at a wavelength of about 10 microns (A micron is the term commonly used in astronomy for a micrometer or one millionth of a meter). In the image to the left, the red areas are the warmest, followed by yellow, green and blue (coolest). The image to the right shows a cat in the infrared. The yellow-white areas are the warmest and the purple areas are the coldest. This image gives us a different view of a familiar animal as well as information that we could not get from a visible light picture. Notice the cold nose and the heat from the cat's eyes, mouth and ears.
Antisymmetric Stretch Bend Symmetric Stretch Infrared Spectroscopy The bonds between atoms in the molecule stretch and bend, absorbing infrared energy and creating the infrared spectrum. A molecule such as H2O will absorb infrared light when the vibration (stretch or bend) results in a molecular dipole moment change
Infrared Spectroscopy A molecule can be characterized (identified) by its molecular vibrations, based on the absorption and intensity of specific infrared wavelengths.
Infrared Spectroscopy For isopropyl alcohol, CH(CH3)2OH, the infrared absorption bands identify the various functional groups of the molecule.
Capabilities of Infrared Analysis • Identification and quantitation of organic solid, liquid or gas samples. • Analysis of powders, solids, gels, emulsions, pastes, pure liquids and solutions, polymers, pure and mixed gases. • Infrared used for research, methods development, quality control and quality assurance applications. • Samples range in size from single fibers only 20 microns in length to atmospheric pollution studies involving large areas.
Applications of Infrared Analysis • Pharmaceutical research • Forensic investigations • Polymer analysis • Lubricant formulation and fuel additives • Foods research • Quality assurance and control • Environmental and water quality analysis methods • Biochemical and biomedical research • Coatings and surfactants • Etc.
Comparison Beetween Dispersion Spectrometer and FTIR Dispersion Spectrometer To separate IR light, a grating is used. Detector Grating Slit In order to measure an IR spectrum,the dispersion Spectrometer takes several minutes. Also the detector receives only a few % of the energy of original light source. Sample To select the specified IR light, A slit is used. Light source FTIR An interferogram is first made by the interferometer using IR light. Fixed CCM In order to measure an IR spectrum,FTIR takes only a few seconds.Moreover, the detector receivesup to 50% of the energy of original light source. (much larger than the dispersion spectrometer.) Detector B.S. Sample Moving CCM The interferogram is calculated and transformed into a spectrum using a Fourier Transform (FT). IR Light source
The Principles of FTIR Method Interferogram is made by an interferometer. Sample Interferogram is transformed into a spectrum using a FT. Sample BKG SB SB Sample/BKG 1000 2000 3000 3000 2000 1000 [cm-1] [cm-1] %T IR spectrum 3000 [cm-1] 2000 1000
FT Optical System Diagram FTIR seminar Light source He-Ne gas laser (ceramic) Beam splitter Movable mirror Sample chamber (DLATGS) Fixed mirror Detector Interferometer
I (X) Interference of two beams of light FTIR seminar Movable mirror Fixed mirror A Movable mirror Same-phase interference wave shape -2l -l 0 l 2l Continuous phase shift Fixed mirror B Movable mirror Opposite-phase interference wave shape Signal strength Fixed mirror C Movable mirror -2l -l 0 l 2l Same-phase interference wave shape 0 l DInterference pattern of light manifested by the optical-path difference
Interference is a superpositioning of waves FTIR seminar Relationship between light source spectrum and the signal output from interferometer Light source spectrum Signal output from interference wave I • Monochromatic • light • (b) Dichroic light • Continuous • spectrum light Az u Wavenumber Time t S I SAz u Wavenumber Time t I(t) b (u) Time t u Wavenumber All intensities are standardized.
Sampling of an actual interferogram FTIR seminar Interferometer interferogram Output of a Laser interferometer Primary interferometer interferogram that was sampled Optical path difference x
Fourier Transform Single strength Fourier transform SB 400 4000 Optical path difference[x] Wavenumber[cm-1] (Interferogram) (Single beam spectrum) Time axis by FFT Wavenumber
Detector Properties FTIR seminar MCT Operates at the temperatur of liquid nitrogen 1010 109 108 D*(l, f) (cmHz1/2W-1) TGS Operates at room temperature 600 4000 Wavenumber[cm-1]
FT-IR Advantages and Disadvantages 1.Better sensitivity and brightness - Allowssimultaneous measurement over the entire wavenumber range - Requires no slit device, making good use of the available beam 2.High wavenumber accuracy - Technique allows high speed sampling with the aid of laser light interference fringes - Requires no wavenumber correction - Provides wavenumber to an accuracy of 0.01 cm-1 3. Resolution - Provides spectra of high resolution 4. Stray light - Fourier Transform allows only interference signals to contribute to spectrum. Background light effects greatly lowers. - Allows selective handling of signals limiting intreference 5. Wavenumber range flexibility - Simple to alter the instrument wavenumber range CO2 and H2O sensitive
FT-IR Advantages • Fellgett's (multiplex) Advantage • FT-IR collects all resolution elements with a complete scan of the interferometer. Successive scans of the FT-IR instrument are coadded and averaged to enhance the signal-to-noise of the spectrum. • Theoretically, an infinitely long scan would average out all the noise in the baseline. • The dispersive instrument collects data one wavelength at a time and collects only a single spectrum. There is no good method for increasing the signal-to-noise of the dispersive spectrum.
FT-IR Advantages • Connes Advantage • an FT-IR uses a HeNe laser as an internal wavelength standard. The infrared wavelengths are calculated using the laser wavelength, itself a very precise and repeatable 'standard'. • Wavelength assignment for the FT-IR spectrum is very repeatable and reproducible and data can be compared to digital libraries for identification purposes.
FT-IR Advantages • Jacquinot Advantage • FT-IR uses a combination of circular apertures and interferometer travel to define resolution. To improve signal-to-noise, one simply collects more scans. • More energy is available for the normal infrared scan and various accessories can be used to solve various sample handling problems. • The dispersive instrument uses a rectangular slit to control resolution and cannot increase the signal-to-noise for high resolution scans. Accessory use is limited for a dispersive instrument.
FT-IR Application Advantages • Opaque or cloudy samples • Energy limiting accessories such as diffuse reflectance or FT-IR microscopes • High resolution experiments (as high as 0.001 cm-1 resolution) • Trace analysis of raw materials or finished products • Depth profiling and microscopic mapping of samples • Kinetics reactions on the microsecond time-scale • Analysis of chromatographic and thermogravimetric sample fractions
FT-IR Terms and Definitions Resolution (common definition) – The separation of the various spectral wavelengths, usually defined in wavenumbers (cm-1). A setting of 4 to 8 cm-1 is sufficient for most solid and liquid samples. Gas analysis experiments may need a resolution of 2 cm-1 or higher. Higher resolution experiments will have lower signal-to-noise.
FT-IR Terms and Definitions Resolution – FT/IR Case A spectrum is said to be collected at a resolution of 1 cm-1 if 4 data points are collected within each spectral interval of 1 cm-1 . In order to acquire a spectrum at higher, an increased number of data points is needed, requiring a longer stroke of the moving mirror. For higher resolution instruments an aperture is needed in order to improve parallelism within interferometer.
FT-IR Terms and Definitions Apodization - a mathematical operation to reduce unwanted oscillation and noise contributions from the interferogram and to avoid aberrations coming from the “finite” nature of real (non theoretical interferograms). Common apodization functions include Beer-Norton, Cosine and Happ-Genzel. Apodization
FT-IR Terms and Definitions Scan mode - Either single beam or ratio. Single beam can be a scan of the background (no sample) or the sample. Ratio mode always implies the sample spectrum divided by, or ratioed against, the single beam background.
FT-IR Terms and Definitions • Scan(s) - a complete cycle of movement of the interferometer mirror. The number of scans collected affects the signal-to-noise ratio (SNR) of the final spectrum. The SNR doubles as the square of the number of scans collected; i.e. 1, 4, 16, 64, 256, …. • Scan speed or optical path velocity - the rate at which the interferometer mirror moves. For a DTGS detector, the SNR decreases as the scan speed increases. • Scan range - spectral range selected for the analysis. The most useful spectral range for mid-infrared is 4000 to 400 cm-1.
New Features of FTIR4000-6000Series The highest S/N ratio in the world, 50,000:1 (FT/IR-6300) (Over sampling with 24-bit ADC) DSP-driven interferometer andnew ADC (18-bit to 24-bit) Digital control of the moving mirror drive using an advanced high speed digital signal processor (DSP) technology The outstanding performance of the ADC (Analog-to digital converter) and DSP (Digital signal processor) allows very rapid and accurate correction for the effects of velocity and position errors. Autoalignment for all models (The interferometer optics can always be aligned by the PC) In addition to proven technology for Rapid scanning and vacuum capabilities; a Step scan capability enables time-resolved studies similar to research models by Nicolet, Bruker and Bio-Rad. IR imaging with IMV-4000 multi-channel microscope for all models (Rapid scanning with a linear array MCT detector ) PC communication and control using USB Aperture of7.1, 5.0, 3.5, 2.5, 1.8, 1.2, 0.9, 0.5 mm diameter for FT/IR-4100/4200 Spectra Manager II (cross-platform software suite for JASCO spectroscopy systems) (Spectra Manager CFR: 21 CFR Part 11 compliance) Research model capability (Upgradeable wavelength extension, high resolution, step scan) Improved Water Vapor and CO2 Compensation
FTIR4000 Series No additional optics for IR microscope interface Standard apertures for optimum S/N and resolution capability Easy replacement of light source and detector FT/IR-4100 FT/IR-4200 Microscope Polymer shell Improved instrument design Compact size Sample compartment with same size as a higher class model Aperture FT/IR-400 Plus
N2gas inlet FTIR4000 Series Purge System Instrument purge is standard for all models of the FT/IR-4000 Series. Control valve FT/IR-4000 Series purge design
S/N ratio (Oversampling system) Accurate mirror drive And reduce flutter at low wavenumber range. FT/IR-4000 & 6000 series Voice Coil Conventional method Voice Coil DSP DAC Analog circuit ADC Pre-amp. Pre-amp. Photo coupler Photo coupler Clock 24-bit AD HeNe laser HeNe laser Over sampling method Find the zero crossings, then interpolate a matching set of IR data points. Reduction of high frequency noise by over sampling with a 16 times greater number of sampling points enables improvement of the S/N ratio.
FTIR6000 Series - Upgradeability - Wide wavenumber range - Full vacuum capability - Step scan upgrade FT/IR-6100 / 6200 / 6300 Microscope FT-Raman Polymer shell Improved instrument design Compact size FT/IR-600Plus FT/IR-6000 Series Optical design
N2gas inlet FTIR6000 Series Purge/Vacuum System Instrument purge is standard for all models of the FT/IR-6000 Series. Purge control valve – front side FT/IR-6000 Series purge design