Download
1 / 40
460 likes | 726 Vues
Time-resolved Fourier Transform Infrared Spectroscopy (FTIR) in Soft Matter research. Outline. Physical processes in the IR spectral range IR spectrometry Fourier Transform Infrared Spectroscopy (FTIR) Quantitative information from IR spectra

E N D
papadopoulos@physik.uni-leipzig.de Time-resolved Fourier Transform Infrared Spectroscopy (FTIR) in Soft Matter research
Outline • Physical processes in the IR spectral range • IR spectrometry • Fourier Transform Infrared Spectroscopy (FTIR) • Quantitative information from IR spectra • Effects of external fields on the molecular level • Time resolved FTIR • Chemical reactions • Conformational changes • ...
IR spectral range Example: CO2 gas • Rotational – vibrational transitions
IR spectral range IR spectra of condensed matter • Gases show complex vibrational-rotational spectra • In soft matter absorption bands are significantly broader H2O CO2 Martin Chaplin, www.physics.umd.edu
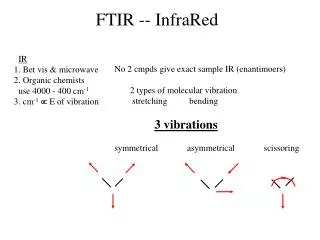
IR spectral range Oscillations – selection rules • Covalent bonds can be described by Morse or LJ potential curves • Quantum harmonic oscillator is a good approximation • Both stretching and bending modes • Single photon is absorbed by interaction with oscillating dipole – transition dipole moment • Absorption coefficient: • No absorption normal to the transition dipole moment : dipole operator Δn=±1 Others weakly allowed, due to anharmonicity (overtones)
IR spectroscopy as analytical tool Widely used as analytical tool Easier preparation than NMR, less quantitative Underestimated! IR and Raman spectroscopy are very powerful techniques IR spectral range 1-octanol
IR spectrometry Grating IR spectrometer • Requirements: • Well collimated beam • Monochromator • Largest part of light intensity is not used • Calibration is necessary
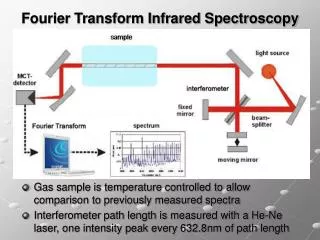
IR spectrometry Fourier Transform Infrared Spectroscopy • Michelson interferometer • Interferogram: intensity vs optical path difference • Intensity at all wavelengths is measured simultaneously γ Optical path difference for each wavelength
IR spectrometry FTIR spectroscopy „white light“ position • Spectrum is easily obtained from the Fourier transform of the interferogram Fourier transform solvent solvent Division
IR spectrometry Resolution – Apodization Fourier transform of Iig(γ) Shape of infinitely thin lines Apodization function • Problem: impossible to integrate interferogram from - to + • Equivalent to multiplying “ideal” interferogram with a “box” function • FT of a product is the convolution of FT‘s • Resolution depends on maximum mirror path~ Δ-1 • Artefacts! • Multiplying with other functions improves quantitative accuracy, but reduces resolution • Apodization=”removing feet” Fourier Transform Infrared Spectrometry, P. R. Griffiths, J.A. de Haseth, Wiley
Advantages of FTIR • Jacquinot advantage • FTIR not as sensitive to beam misalignment, allowing for larger aperture – throughput • Fellget advantage (“multiplex”) • All frequencies measured together • Connes advantage • Built-in calibration, mirror position determined by He-Ne laser • FTIR is exclusively used nowadays
Transmission – reflection modes Transmission - absorption Specular reflection • Simplified: no interference, etc. Absorbance Reflectivity Absorption coefficient α Molar absorption coefficient ε=α/c Normal incidence in air Lambert-Beer law:
Complex refractive index • The imaginary part is proportional to the absorption coefficient • Dielectric function • Real and imaginary parts are related through Kramers-Kronig relations Example: polycarbonate Fourier Transform Infrared Spectrometry, P. R. Griffiths, J.A. de Haseth, Wiley
IR spectral range Polarization dependence • Example: salol crystal • All transition dipoles (for a certain transition) are perfectly aligned • Intensity of absorption bands depends greatly on crystal orientation • Dichroism: difference of absorption coefficient between two axes • Biaxiality (all three axes different) salol Vibrational Spectroscopy in Life Science, F. Siebert, P. Hildebrandt J. Hanuza et al. / Vib. Spectrosc. 34 (2004) 253–268
IR spectral range Order parameter • Non-crystalline solids: molecules (and transition dipole moments) are not (perfectly) aligned • Rotational symmetry is common • Different absorbance A|| and A • Dichroic ratio R= A|| / A • Molecular order parameter Reference axis Molecular segment Transition dipole “parallel” vibration || “perpendicular” vibration
Experimental Order of crystals and amorphous phase in spider silk p: transition dipole moment Low order of glycine-rich amorphous chains High order of alanine-rich crystals Papadopoulos et al., Eur. Phys. J. E, 24, 193 (2007) Glisovic et al.Macromolecules41, 390 (2008)
Examples of structural changes in soft matter Lemieux, R. P. Acc. Chem. Res. 2001, 34, 845-853 • Phase transitions • liquid crystals • Conformational changes • Protein secondary structure • In many cases these processes take place very fast (< s) • Cannot be probed by X-rays or NMR
Time-resolved measurements • Two possibilities: • Collect interferogram as fast as possible (“rapid scan”) • Synchronize spectrometer with external event (“step scan”)
Time-resolved FTIR Rapid scan - kinetics • Interferograms are collected successively • Time resolution down to a few ms (depending on spectral resolution) • Non-repetitive processes • Cannot average scans • noise
Time-resolved FTIR Irreversible processes For faster processes: Static measurements at different spots of a flow cell • Rapid scan is useful for studying chemical reactions and phase transitions Synthesis of polyurethane crystal Reaction time Crystallization of a liquid crystal by T-jump 90°C 36°C amorphous de Haseth et al., Appl. Spectrosc., 47, 173 (1993) Takahashi et al.J. Biol. Chem.270, 8405 (1995)
Time-resolved FTIR Step scan • Differences from rapid scan kinetics: • Interferograms are not measured successively • Triggered event is repeated for every mirror step • Allows study of very fast processes • down to ns, ps -> chemical reactions • Lower noise than kinetics • Disadvantages: • Limited to repetitive processes • Sensitive to system instabilities
Time-resolved FTIR Step scan • Stroboscopic technique • Mirror moves stepwise • All measurements after a certain dt from trigger are assembled to make a single interferogram • All interferograms are collected in a single scan • One scan takes longer than rapid scan, but much higher time resolution
Time-resolved FTIR Step scan example: spider silk
Experimental IR detector Force sensor Piezo crystals – DC motors sample polarizer IR beam Combined IR and mechanical spectroscopy Transmission mode using microscope • Tracing microscopic effects of strain • Possible to extract order parameter dependence on external fields • Dynamic Infrared Linear Dichroism (DIRLD)
Time-resolved FTIR Preparation of Step Scan measurement • Process studied with Step Scan FTIR should be reproducible • Several cycles should be run before actual measurement Measurement should start at this point to ensure reproducibility
Time-resolved FTIR DIRLD in polymers • Dichroic ratio depends on strain • Polymer chains become better oriented • Different trend for dipole moments parallel and normal to the chain Natural rubber (polyisoprene) polystyrene S. Toki et al. / Polymer 41 (2000) 5423–5429 I. Noda et al. / Appl. Spectrosc. 42 (1988) 203–216
Time-resolved FTIR External – crystal stress comparison: Phase • The step-scan technique allows IR measurements with high time resolution • Crystal stress can be measured as a function of time under sinusoidal external field • Phase shift < 2° R. Ene et al. / Soft Matter, 2009, 5, 4568–4574
What is the origin of frequency shifts? Vibrational frequency depends on: Atom mass Bond force constant Number of atoms involved in vibration Perturbations H-bonding Conformation Anharmonicity Thermal expansion External fields (in this case)
Quantum Perturbation Theory • The shift is~ 0.3 % • QPT is applicable • The bond anharmonicity gives rise to the shift of energy levels Theoretical value P. Papadopoulos et al. Eur. Phys. J. E24, 193 (2007)
Microscopic – macroscopic stress in silk • Crystal stress is equal to the externally applied • At time scales from µs to hours • Independent of sample history • Serial connection of crystals PP, J. Sölter, F. Kremer Eur. Phys. J. E24, 193 (2007)
Time-resolved FTIR Photoinduced protein folding • Bacteriorhodopsin structure changes after visible photon absorption • IR photons do not have enough energy to change structure, just probe vibrations! • Pulsed laser is synchronized with spectrometer • Retinal conformational changes during the complete cycle (~ms) are observed retinal R. Rammelsberg et al. Appl. Spectrosc.51, 558 (1997)
Time-resolved FTIR Folding kinetics of peptides after T-jumps • Alanine-based peptide • Secondary structure depends on temperature (coil at higher T) • Reaction rate “constants“ can be studied by T-jumps • IR laser pulses synchronized with spectrometer heat the sample by ~ 10°C • The sum ku+kf is determined by kinetics, ratio ku/kf by equilibrium T. Wang et al. J. Phys. Chem. B 108, 15301 (2004)
Summary • Fourier Transform IR spectroscopy is an ideal tool to study fast processes • High sensitivity • Information for different molecular groups • High time resolution • Time resolved measurements • Rapid scan • Step scan • Effects of external perturbations in various systems: • Polymers • Proteins • Liquid crystals, ... Thank you for your attention! http://www.uni-leipzig.de/~mop/lectures
Spider silk Chemical structure of dragline silk and PA6 • Block copolymer • Two high-MW proteins (MaSp1 and MaSp2) • Semi-crystalline • High Ala- and Gly- content Repetitive pattern C-term. N-term. MaSp1 AAAAAAA GGX GGX GGX GGX GA GGX GGX n AAAAAAA GPGXX GPGXX GPGXX GPGXX GPGXX MaSp2 n Hydrophobic Slightly hydrophilic PA6 (Nylon):
Normal vibrational modes Simple relations only in diatomic molecules! Vibrations involve more than two atoms Especially at low frequencies Example: amide bond C H N O C Amide I Amide II Amide III Amide IV
Experimental Absorption spectrum of silk • Typical protein spectrum • Amide vibrations dominate, but ... • They cannot give aminoacid-specific information • The region 1100 – 900 cm-1 can be used instead
C N N-terminus C-terminus N-terminus C N C N C-terminus N-terminus N-terminus C-terminus C N Antiparallel and parallel b-sheet structure C-terminus Poly(alanine) segment Rotondi, K. S.; Gierasch, L. M. Biopolymers2005, 84, 13-22. Simmons, A.; Ray, E.; Jelinski, L. W. Macromolecules 1994, 27, 5235-5237.
Polyaminoacid IR spectra • Dragline silk and b-polyalanine A. M. Dwivedi, S. Krimm Macromolecules 15, 186 (1982)
Similar findings in PA6 Similar to silk, orientation before crystallization induces the high order • Crystal vibration responds linearly to applied stress • Both spider silk and PA6 are glassy at room temperature
Rotational – vibrational transitions • The fine structure of gas vibrational spectra is due to the vibrational transitions • Selection rules: • Δn=±1 • ΔJ=±1 (and 0 in certain cases) • Relation between integrated molar absorption coefficient and transition dipole moment: H.C. Haken – H. Wolf Molecular Physics and Elements of Quantum Chemistry Chapter 15


![Fourier transform infrared spectroscopy[FTIR]](https://cdn1.slideserve.com/2743434/fourier-transform-infrared-spectroscopy-ftir-dt.jpg)