Download
1 / 10
460 likes | 1.55k Vues
Fourier transform infrared spectroscopy. Light transmission through a material. Functional chemical groups absorb energy at specific wavelengths. Less light is transmitted at those wavelengths. Recall from physics: Where is the wavenumber .

E N D
Fourier transform infrared spectroscopy 298klg-34
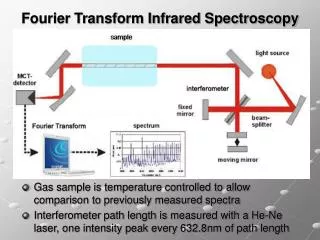
Light transmission through a material Functional chemical groups absorb energy at specific wavelengths. Less light is transmitted at those wavelengths. Recall from physics: Where is the wavenumber. The transmission spectrum is a “fingerprint” of the substance. 298klg-34
Spectrophotometer The monochromator disperses the light by wavelength. The aperture is used to select one wavelength at a time. Even if the light source is intense, most is blocked by the aperture. The result is a time-consuming process with low signal strength 298klg-34
Michelson interferometer This creates a pulse of light that is transmitted through the sample. 298klg-34
Interference patterns One wavelength Twenty discrete wavelengths 298klg-34
Path length difference Proportional to time because mirror velocity is known Interference pattern From a white light (or broad wavelength) source 298klg-34
The output spectrum This spectrum is the product of the absorption spectrum the sample and the spectrum of the incident light. 298klg-34
Fourier Transform Infrared (FTIR) Spectrometer FPA – focal plane array, similar to the detector in a digital camera From Walsh, Reddy, and Bhargava, “Label-free biomedical imaging with mid-IR spectroscopy,” IEEE J. Selected Topics in Quantum Electronics, Vol. 18, No. 4, July/August 2012. link 298klg-34
At each pixel, a spectrum is measured Analysis of each spectrum gives the types of molecules present in that pixel (and relative amounts) and thus the tissue type. From Walsh, Reddy, and Bhargava, “Label-free biomedical imaging with mid-IR spectroscopy,” IEEE J. Selected Topics in Quantum Electronics, Vol. 18, No. 4, July/August 2012. link 298klg-34
Cervical cancer screening Black indicates normal cell spectra Green and blue indicate pre-invasive disease Red indicates a possibility that the disease has become invasive From Walsh, et al, “IR microspectroscopy: potential applications in cervical cancer screening”, Cancer Letters, Vol. 246, Issues 1–2, 8 February 2007, Pages 1-11. link 298klg-34


![Fourier transform infrared spectroscopy[FTIR]](https://cdn1.slideserve.com/2743434/fourier-transform-infrared-spectroscopy-ftir-dt.jpg)