Download
1 / 1
10 likes | 83 Vues
Machine Learning Methods for the Understanding and Prediction of Climate Systems: Tropical Pacific Ocean Thermocline and ENSO Events Abstract GC43A-1014. Carlos H. R. Lima - Depto. of Civil and Environmental Engineering, University of Brasilia. Brazil. chrlima@unb.br

E N D
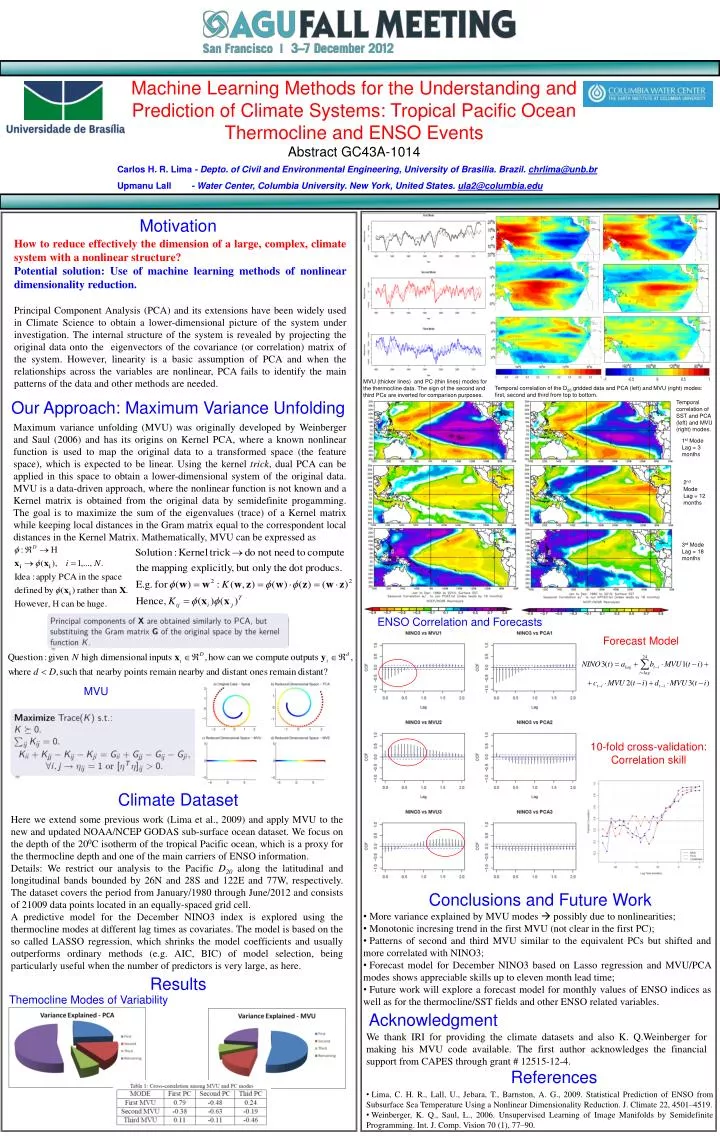
Machine Learning Methods for the Understanding and Prediction of Climate Systems: Tropical Pacific Ocean Thermocline and ENSO Events Abstract GC43A-1014 Carlos H. R. Lima - Depto. of Civil and Environmental Engineering, University of Brasilia. Brazil. chrlima@unb.br Upmanu Lall - Water Center, Columbia University. New York, United States. ula2@columbia.edu Motivation How to reduce effectively the dimension of a large, complex, climate system with a nonlinear structure? Potential solution: Use of machine learning methods of nonlinear dimensionality reduction. Principal Component Analysis (PCA) and its extensions have been widely used in Climate Science to obtain a lower-dimensional picture of the system under investigation. The internal structure of the system is revealed by projecting the original data onto the eigenvectors of the covariance (or correlation) matrix of the system. However, linearity is a basic assumption of PCA and when the relationships across the variables are nonlinear, PCA fails to identify the main patterns of the data and other methods are needed. MVU (thicker lines) and PC (thin lines) modes for the thermocline data. The sign of the second and third PCs are inverted for comparison purposes. Temporal correlation of the D20 gridded data and PCA (left) and MVU (right) modes: first, second and third from top to bottom. Our Approach: Maximum Variance Unfolding Temporal correlation of SST and PCA (left) and MVU (right) modes. Maximum variance unfolding (MVU) was originally developed by Weinberger and Saul (2006) and has its origins on Kernel PCA, where a known nonlinear function is used to map the original data to a transformed space (the feature space), which is expected to be linear. Using the kernel trick, dual PCA can be applied in this space to obtain a lower-dimensional system of the original data. MVU is a data-driven approach, where the nonlinear function is not known and a Kernel matrix is obtained from the original data by semidefinite progamming. The goal is to maximize the sum of the eigenvalues (trace) of a Kernel matrix while keeping local distances in the Gram matrix equal to the correspondent local distances in the Kernel Matrix. Mathematically, MVU can be expressed as 1st Mode Lag = 3 months 2nd Mode Lag = 12 months 3rd Mode Lag = 18 months ENSO Correlation and Forecasts Forecast Model MVU 10-fold cross-validation: Correlation skill Climate Dataset Here we extend some previous work (Lima et al., 2009) and apply MVU to the new and updated NOAA/NCEP GODAS sub-surface ocean dataset. We focus on the depth of the 200C isotherm of the tropical Pacific ocean, which is a proxy for the thermocline depth and one of the main carriers of ENSO information. Details: We restrict our analysis to the Pacific D20along the latitudinal and longitudinal bands bounded by 26N and 28S and 122E and 77W, respectively. The dataset covers the period from January/1980 through June/2012 and consists of 21009 data points located in an equally-spaced grid cell. A predictive model for the December NINO3 index is explored using the thermocline modes at different lag times as covariates. The model is based on the so called LASSO regression, which shrinks the model coefficients and usually outperforms ordinary methods (e.g. AIC, BIC) of model selection, being particularly useful when the number of predictors is very large, as here. Conclusions and Future Work • More variance explained by MVU modes possibly due to nonlinearities; • Monotonic incresing trend in the first MVU (not clear in the first PC); • Patterns of second and third MVU similar to the equivalent PCs but shifted and more correlated with NINO3; • Forecast model for December NINO3 based on Lasso regression and MVU/PCA modes shows appreciable skills up to eleven month lead time; • Future work will explore a forecast model for monthly values of ENSO indices as well as for the thermocline/SST fields and other ENSO related variables. Results Themocline Modes of Variability Acknowledgment We thank IRI for providing the climate datasets and also K. Q.Weinberger for making his MVU code available. The first author acknowledges the financial support from CAPES through grant # 12515-12-4. References • Lima, C. H. R., Lall, U., Jebara, T., Barnston, A. G., 2009. Statistical Prediction of ENSO from Subsurface Sea Temperature Using a Nonlinear Dimensionality Reduction. J. Climate 22, 4501–4519. • Weinberger, K. Q., Saul, L., 2006. Unsupervised Learning of Image Manifolds by Semidefinite Programming. Int. J. Comp. Vision 70 (1), 77–90.