Download
1 / 23
230 likes | 340 Vues
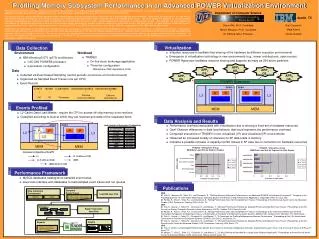
Memory Performance Profiling via Sampled Performance Monitor Event Traces. Diana Villa , Patricia J. Teller, and Jaime Acosta The University of Texas at El Paso Department of Computer Science Trevor Morgan Exxon/Mobil Bret Olszewski IBM Corporation-Austin.

E N D
Memory Performance Profiling via Sampled Performance Monitor Event Traces Diana Villa, Patricia J. Teller, and Jaime Acosta The University of Texas at El Paso Department of Computer Science Trevor Morgan Exxon/Mobil Bret Olszewski IBM Corporation-Austin 5th Annual IBM Austin CAS Conference – 20 February 2004
Outline • Motivation • Data • Events Profiled • Information Collected • Analysis • Approach • Performance Evaluation Framework • Results • Conclusions and Future Work 5th Annual IBM Austin CAS Conference – 20 February 2004
Motivation • Overall research goal General workload characterization model • Project goal • Develop a performance evaluation framework to facilitate analysis of large sampled event traces • Study load access patterns of key applications • Identify and remedy performance impediments 5th Annual IBM Austin CAS Conference – 20 February 2004
Data Collection Environment • IBM eserver p-Series 690 architecture 8- and 32-processor configurations • TPC-C benchmark Data collected via event trace sampling: • Timestamp • Effective instruction and data addresses • CPU id • Process id • Thread id 5th Annual IBM Austin CAS Conference – 20 February 2004
Platform -1 8-processor p690 configuration L3 L3 MCM 0 MCM 1 P X P X P X P X L2 L2 L2 L2 P P X P X P X X L2 L2 L2 L2 5th Annual IBM Austin CAS Conference – 20 February 2004
Platform - 2 32-processor p690 configuration L3 MCM 0 MCM 1 L3 P P P P P P P P L2 L2 L2 L2 P P P P P P P P L2 L2 L2 L2 L3 MCM 2 MCM 3 L3 P P P P P P P P L2 L2 L2 L2 P P P P P P P P L2 L2 L2 L2 5th Annual IBM Austin CAS Conference – 20 February 2004
Events • Resolution of L2-cache data-load misses • L2.5 • L2.5 shared • L2.5 modified • L2.75 • L2.75 shared • L2.75 modified • L3 • L3.5 5th Annual IBM Austin CAS Conference – 20 February 2004
L2.5 L3 L3 MCM 0 MCM 1 P X P X P X P X L2 L2 L2 L2 P P X P X P X X L2 L2 L2 L2 Penalty: 73 cycles 5th Annual IBM Austin CAS Conference – 20 February 2004
L2.75 L3 L3 MCM 0 MCM 1 P X P X P X P X L2 L2 L2 L2 P P X P X P X X L2 L2 L2 L2 Penalty: 96 cycles 5th Annual IBM Austin CAS Conference – 20 February 2004
L3 L3 L3 MCM 0 MCM 1 P X P X P X P X L2 L2 L2 L2 P P X P X P X X L2 L2 L2 L2 Penalty: 112 cycles 5th Annual IBM Austin CAS Conference – 20 February 2004
L3.5 L3 L3 MCM 0 MCM 1 P X P X P X P X L2 L2 L2 L2 P P X P X P X X L2 L2 L2 L2 Penalty: 143 cycles 5th Annual IBM Austin CAS Conference – 20 February 2004
Page Segment Page Offset/ Cache line Analysis • Identify application-specific sources of performance degradation associated with data references Address Space …. kernel …. Level of Memory Hierarchy text …. data,bss,heap …. buffer pool …. 5th Annual IBM Austin CAS Conference – 20 February 2004
Data Collection Environment TPC-C p690 Sampled Event Traces PID TID Timestamp Instr.Addr. DataAddr. PID TID Timestamp Instr.Addr. DataAddr. PID TID Timestamp Instr.Addr. DataAddr. Reports 5 BufferPool 56893 29384 6 Data,BSS,Heap 8799 4855 1 Kernel 23485 9840 Graphs Database Load DB Java Tool Report Generation Java Tool Performance Evaluation Framework 5th Annual IBM Austin CAS Conference – 20 February 2004
Results 5th Annual IBM Austin CAS Conference – 20 February 2004
Results - Memory Regions 5th Annual IBM Austin CAS Conference – 20 February 2004
Results - L3 Cache 5th Annual IBM Austin CAS Conference – 20 February 2004
Results - Segment 5th Annual IBM Austin CAS Conference – 20 February 2004
Results - Pages 5th Annual IBM Austin CAS Conference – 20 February 2004
Results – Cache Lines 5th Annual IBM Austin CAS Conference – 20 February 2004
Results - Instructions 5th Annual IBM Austin CAS Conference – 20 February 2004
Conclusions • Targets for performance improvement of TPC-C are associated mainly with two regions of the address space: • buffer pool • data, bss, heap • TPC-C lock instructions are not key to performance degradation • 8- and 32-processor data have same reference pattern, thus, a model of TPC-C memory access may be possible 5th Annual IBM Austin CAS Conference – 20 February 2004
Future Work • Suggest ways to improve performance of applications executed on p690 • Enhance performance evaluation framework • Quantify representativeness of sampled event traces • Expand study of application data load behavior • Process characterization • Process migration • Other performance issues • Compulsory vs. capacity/conflict misses • False sharing • Contention for resources • Develop synthetic applications that mimic the behavior of key p690 applications; use these to study application behavior and experiment with modifications to applications that may affect performance 5th Annual IBM Austin CAS Conference – 20 February 2004
Questions? 5th Annual IBM Austin CAS Conference – 20 February 2004