Download
1 / 16
160 likes | 262 Vues
July 5-9, 2009, Univ. of Bologna, Italy HARP - A Software Tool for Fast Assessment of Radiation Accident Consequences and their Variability Petr Pecha and Radek Hofman pecha@utia.cas.cz

E N D
July 5-9, 2009, Univ. of Bologna, Italy HARP - A Software Tool for Fast Assessment of Radiation Accident Consequences and their Variability Petr Pecha and Radek Hofman pecha@utia.cas.cz Institute of Information Theory and Automation v.v.i., Czech Academy of Sciences, 182 08 Prague, Pod vodarenskou vezi 4, Czech Republic
Main features of the HARP system • Designed for fast assessment of radiological consequences of accidental releases of radionuclides into the living environment. • Transport of toxic agens is studied from initial atmospheric propagation up to 100 kilometeres from the source of pollution. • Deposition and successive radioactivity transport toward human body is modeled. • Deterministic estimation of consequences is superseded by probabilistic approach. • The product is intended for its utilization e.g. for staff training or students' education.
THE FINAL GOAL OF DEVELOPMENT Integration of assimilation subsystem ([5],[4]) for improvement of model predictions using observations incoming from terrain
HARPFLOWCHART – deterministic and probabilistic components
INTERACTIVE INPUTS Interactive regime offers wide range of input data and model parameters alternative options thus enabling fast examination of their variability and uncertainty on random fluctuations of resulting outputs. INTERACTIVE INPUT SUBSYSTEMS: 1) Atm. dispersion model and release scenario definitions 2) Ingestion parameters definitions 3) LHS – (Latin Hypercube Sampling) for simulation of uncertainty propagationthrough the model
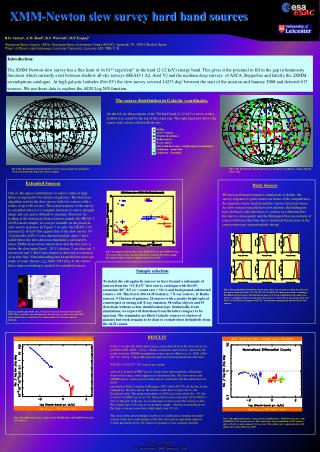
Example of the HARP applications – „red eye“due to local atmospheric precipitation Spatial distribution of 137Cs activity deposition on terrain [Bq /m2]. Deterministic „best estimate" (left) is compared with probabilistic calculation of sample mean (right - 5000 samples). The „red eye“ in deposited activity is caused by local atmospheric precipitation, which occurred between hours 5 to 6 after the release start (random rain intensity has uniform distribution U[0; 6mm / hour] ). Signifiance of probabilistic assessment approach is evident. It enables generate more informative probabilistic answers on assessment questions.
Example of the HARP applications – significance of discrimination between local or global character of uncertainty effect Cross section through the model error covariance matrix for the „red eye“ scenario with local rain dark: strong positive covariance white: negative covariance (without detail scale) Covariances of the fixed point in the centre of rain zone with all other nodes ( only one random input parameter assumed → rain intensity)
Example of the HARP applications - 137Cs deposition on terrain : result of long-term release with duration 3 month (real weather statistics was used)
Example of the HARP applications– TWIN experiment for assimilation (measurements locations in black squares selected artifically)
Example of the HARP applications– arrangement for TWIN experiment for data assimilation with real receptors of the Czech Early Warning system (red squares)